


More on NFTs & Art

Web3Lunch
3 years ago
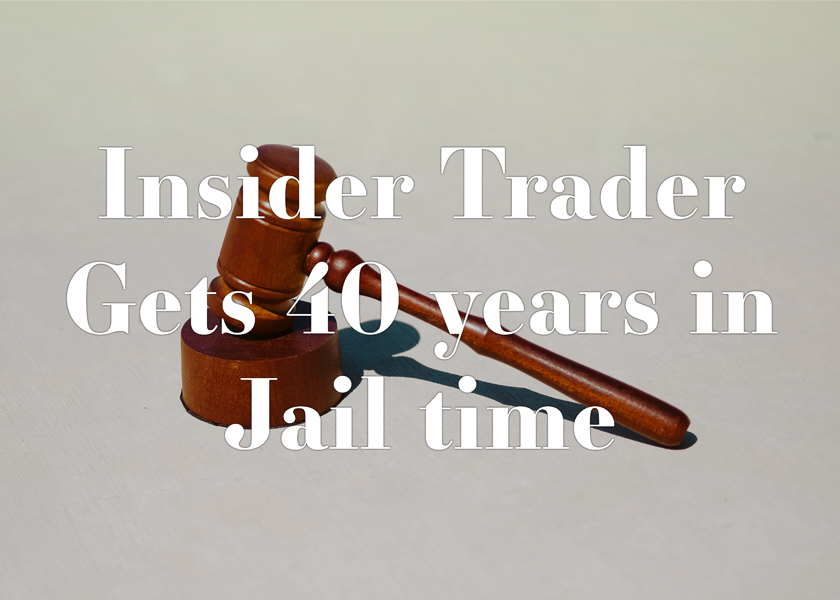
An employee of OpenSea might get a 40-year prison sentence for insider trading using NFTs.
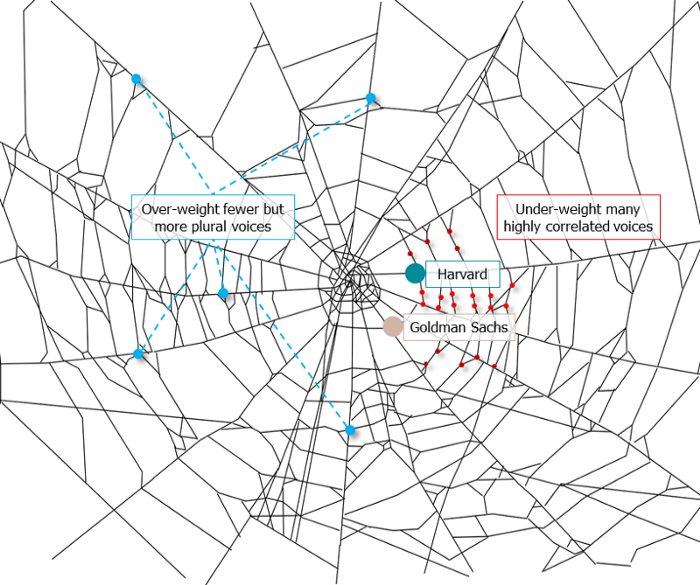
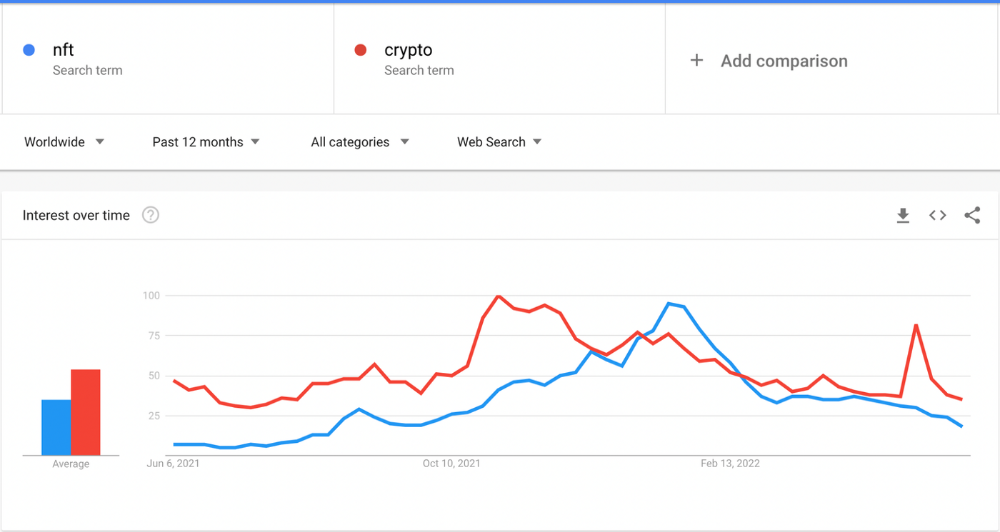
The space had better days. Those greenish spikes...oh wow, haven't felt that in ages. Cryptocurrencies and NFTs have lost popularity. Google agrees. Both are declining.
As seen below, crypto interest spiked in May because of the Luna fall. NFT interest is similar to early October last year.
This makes me think NFTs are mostly hype and FOMO. No art or community. I've seen enough initiatives to know that communities stick around if they're profitable. Once it starts falling, they move on to the next project. The space has no long-term investments. Flip everything.
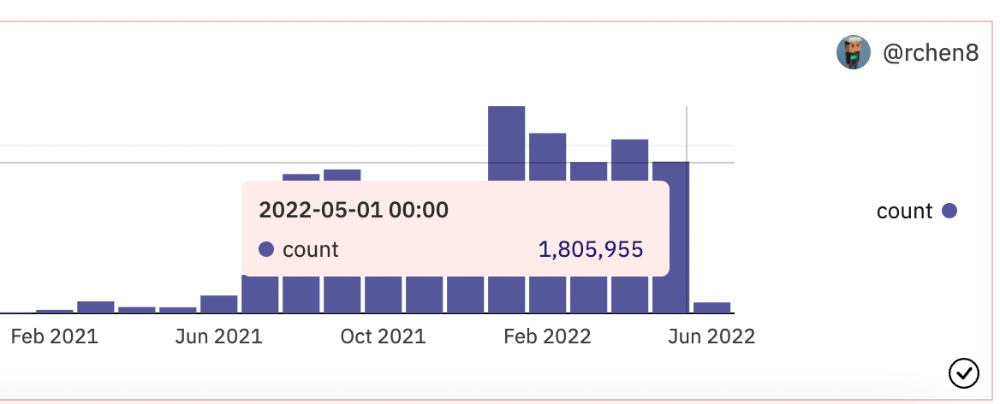
OpenSea trading volume has stayed steady for months. May's volume is 1.8 million ETH ($3.3 billion).
Despite this, I think NFTs and crypto will stick around. In bad markets, builders gain most.
Only 4k developers are active on Ethereum blockchain. It's low. A great chance for the space enthusiasts.
An employee of OpenSea might get a 40-year prison sentence for insider trading using NFTs.
Nathaniel Chastian, an OpenSea employee, traded on insider knowledge. He'll serve 40 years for that.
Here's what happened if you're unfamiliar.
OpenSea is a secondary NFT marketplace. Their homepage featured remarkable drops. Whatever gets featured there, NFT prices will rise 5x.
Chastian was at OpenSea. He chose forthcoming NFTs for OpenSeas' webpage.
Using anonymous digital currency wallets and OpenSea accounts, he would buy NFTs before promoting them on the homepage, showcase them, and then sell them for at least 25 times the price he paid.
From June through September 2021, this happened. Later caught, fired. He's charged with wire fraud and money laundering, each carrying a 20-year maximum penalty.
Although web3 space is all about decentralization, a step like this is welcomed since it restores faith in the area. We hope to see more similar examples soon.
Here's the press release.
Understanding smart contracts
@cantino.eth has a Twitter thread on smart contracts. Must-read. Also, he appears educated about the space, so follow him.

Yuga Labs
4 years ago
Yuga Labs (BAYC and MAYC) buys CryptoPunks and Meebits and gives them commercial rights
Yuga has acquired the CryptoPunks and Meebits NFT IP from Larva Labs. These include 423 CryptoPunks and 1711 Meebits.
We set out to create in the NFT space because we admired CryptoPunks and the founders' visionary work. A lot of their work influenced how we built BAYC and NFTs. We're proud to lead CryptoPunks and Meebits into the future as part of our broader ecosystem.
"Yuga Labs invented the modern profile picture project and are the best in the world at operating these projects. They are ideal CrytoPunk and Meebit stewards. We are confident that in their hands, these projects will thrive in the emerging decentralized web.”
–The founders of Larva Labs, CryptoPunks, and Meebits
This deal grew out of discussions between our partner Guy Oseary and the Larva Labs founders. One call led to another, and now we're here. This does not mean Matt and John will join Yuga. They'll keep running Larva Labs and creating awesome projects that help shape the future of web3.
Next steps
Here's what we plan to do with CryptoPunks and Meebits now that we own the IP. Owners of CryptoPunks and Meebits will soon receive commercial rights equal to those of BAYC and MAYC holders. Our legal teams are working on new terms and conditions for both collections, which we hope to share with the community soon. We expect a wide range of third-party developers and community creators to incorporate CryptoPunks and Meebits into their web3 projects. We'll build the brand alongside them.
We don't intend to cram these NFT collections into the BAYC club model. We see BAYC as the hub of the Yuga universe, and CryptoPunks as a historical collection. We will work to improve the CryptoPunks and Meebits collections as good stewards. We're not in a hurry. We'll consult the community before deciding what to do next.
For us, NFTs are about culture. We're deeply invested in the BAYC community, and it's inspiring to see them grow, collaborate, and innovate. We're excited to see what CryptoPunks and Meebits do with IP rights. Our goal has always been to create a community-owned brand that goes beyond NFTs, and now we can include CryptoPunks and Meebits.

Anton Franzen
3 years ago
This is the driving force for my use of NFTs, which will completely transform the world.
Its not a fuc*ing fad.
It's not about boring monkeys or photos as nfts; that's just what's been pushed up and made a lot of money. The technology underlying those ridiculous nft photos will one day prove your house and automobile ownership and tell you where your banana came from. Are you ready for web3? Soar!
People don't realize that absolutely anything can and will be part of the blockchain and smart contracts, making them even better. I'll tell you a secret: it will and is happening.
Why?
Why is something blockchain-based a good idea? So let’s speak about cars!
So a new Tesla car is manufactured, and when you buy it, it is bound to an NFT on the blockchain that proves current ownership. The NFT in the smart contract can contain some data about the current owner of the car and some data about the car's status, such as the number of miles driven, the car's overall quality, and so on, as well as a reference to a digital document bound to the NFT that has more information.
Now, 40 years from now, if you want to buy a used automobile, you can scan the car's serial number to view its NFT and see all of its history, each owner, how long they owned it, if it had damages, and more. Since it's on the blockchain, it can't be tampered with.
When you're ready to buy it, the owner posts it for sale, you buy it, and it's sent to your wallet. 5 seconds to change owner, 100% safe and verifiable.
Incorporate insurance logic into the car contract. If you crashed, your car's smart contract would take money from your insurance contract and deposit it in an insurance company wallet.
It's limitless. Your funds may be used by investors to provide insurance as they profit from everyone's investments.
Or suppose all car owners in a country deposit a fixed amount of money into an insurance smart contract that promises if something happens, we'll take care of it. It could be as little as $100-$500 per year, and in a country with 10 million people, maybe 3 million would do that, which would be $500 000 000 in that smart contract and it would be used by the insurance company to invest in assets or take a cut, literally endless possibilities.
Instead of $300 per month, you may pay $300 per year to be covered if something goes wrong, and that may include multiple insurances.
What about your grocery store banana, though?
Yes that too.
You can scan a banana to learn its complete history. You'll be able to see where it was cultivated, every middleman in the supply chain, and hopefully the banana's quality, farm, and ingredients used.
If you want locally decent bananas, you can only buy them, offering you transparency and options. I believe it will be an online marketplace where farmers publish their farms and products for trust and transparency. You might also buy bananas from the farmer.
And? Food security to finish the article. If an order of bananas included a toxin, you could easily track down every banana from the same origin and supply chain and uncover the root cause. This is a tremendous thing that will save lives and have a big impact; did you realize that 1 in 6 Americans gets poisoned by food every year? This could lower the number.
To summarize:
Smart contracts can issue nfts as proof of ownership and include functionality.
You might also like

Max Parasol
4 years ago
Are DAOs the future or just a passing fad?
How do you DAO? Can DAOs scale?
DAO: Decentralized Autonomous. Organization.
“The whole phrase is a misnomer. They're not decentralized, autonomous, or organizations,” says Monsterplay blockchain consultant David Freuden.
As part of the DAO initiative, Freuden coauthored a 51-page report in May 2020. “We need DAOs,” he says. “‘Shareholder first' is a 1980s/90s concept. Profits became the focus, not products.”
His predictions for DAOs have come true nearly two years later. DAOs had over 1.6 million participants by the end of 2021, up from 13,000 at the start of the year. Wyoming, in the US, will recognize DAOs and the Marshall Islands in 2021. Australia may follow that example in 2022.
But what is a DAO?
Members buy (or are rewarded with) governance tokens to vote on how the DAO operates and spends its money. “DeFi spawned DAOs as an investment vehicle. So a DAO is tokenomics,” says Freuden.
DAOs are usually built around a promise or a social cause, but they still want to make money. “If you can't explain why, the DAO will fail,” he says. “A co-op without tokenomics is not a DAO.”
Operating system DAOs, protocol DAOs, investment DAOs, grant DAOs, service DAOs, social DAOs, collector DAOs, and media DAOs are now available.
Freuden liked the idea of people rallying around a good cause. Speculators and builders make up the crypto world, so it needs a DAO for them.
,Speculators and builders, or both, have mismatched expectations, causing endless, but sometimes creative friction.
Organisms that boost output
Launching a DAO with an original product such as a cryptocurrency, an IT protocol or a VC-like investment fund like FlamingoDAO is common. DAOs enable distributed open-source contributions without borders. The goal is vital. Sometimes, after a product is launched, DAOs emerge, leaving the company to eventually transition to a DAO, as Uniswap did.
Doing things together is a DAO. So it's a way to reward a distributed workforce. DAOs are essentially productivity coordination organisms.
“Those who work for the DAO make permissionless contributions and benefit from fragmented employment,” argues Freuden. DAOs are, first and foremost, a new form of cooperation.
DAO? Distributed not decentralized
In decentralized autonomous organizations, words have multiple meanings. DAOs can emphasize one aspect over another. Autonomy is a trade-off for decentralization.
DAOstack CEO Matan Field says a DAO is a distributed governance system. Power is shared. However, there are two ways to understand a DAO's decentralized nature. This clarifies the various DAO definitions.
A decentralized infrastructure allows a DAO to be decentralized. It could be created on a public permissionless blockchain to prevent a takeover.
As opposed to a company run by executives or shareholders, a DAO is distributed. Its leadership does not wield power
Option two is clearly distributed.
But not all of this is “automated.”
Think quorum, not robot.
DAOs can be autonomous in the sense that smart contracts are self-enforcing and self-executing. So every blockchain transaction is a simplified smart contract.
Dao landscape
The DAO landscape is evolving.
Consider how Ethereum's smart contracts work. They are more like self-executing computer code, which Vitalik Buterin calls “persistent scripts”.
However, a DAO is self-enforcing once its members agree on its rules. As such, a DAO is “automated upon approval by the governance committee.” This distinguishes them from traditional organizations whose rules must be interpreted and applied.
Why a DAO? They move fast
A DAO can quickly adapt to local conditions as a governance mechanism. It's a collaborative decision-making tool.
Like UkraineDAO, created in response to Putin's invasion of Ukraine by Ukrainian expat Alona Shevchenko, Nadya Tolokonnikova, Trippy Labs, and PleasrDAO. The DAO sought to support Ukrainian charities by selling Ukrainian flag NFTs. With a single mission, a DAO can quickly raise funds for a country accepting crypto where banks are distrusted.
This could be a watershed moment for DAOs.
ConstitutionDAO was another clever use case for DAOs for Freuden. In a failed but “beautiful experiment in a single-purpose DAO,” ConstitutionDAO tried to buy a copy of the US Constitution from a Sotheby's auction. In November 2021, ConstitutionDAO raised $47 million from 19,000 people, but a hedge fund manager outbid them.
Contributions were returned or lost if transactional gas fees were too high. The ConstitutionDAO, as a “beautiful experiment,” proved exceptionally fast at organizing and crowdsourcing funds for a specific purpose.
We may soon be applauding UkraineDAO's geopolitical success in support of the DAO concept.
Some of the best use cases for DAOs today, according to Adam Miller, founder of DAOplatform.io and MIDAO Directory Services, involve DAO structures.
That is, a “flat community is vital.” Prototyping by the crowd is a good example. To succeed, members must be enthusiastic about DAOs as an alternative to starting a company. Because DAOs require some hierarchy, he agrees that "distributed is a better acronym."
Miller sees DAOs as a “new way of organizing people and resources.” He started DAOplatform.io, a DAO tooling advisery that is currently transitioning to a DAO due to the “woeful tech options for running a DAO,” which he says mainly comprises of just “multisig admin keys and a voting system.” So today he's advising on DAO tech stacks.
Miller identifies three key elements.
Tokenization is a common method and tool. Second, governance mechanisms connected to the DAO's treasury. Lastly, community.”
How a DAO works...
They can be more than glorified Discord groups if they have a clear mission. This mission is a mix of financial speculation and utopianism. The spectrum is vast.
The founder of Dash left the cryptocurrency project in 2017. It's the story of a prophet without an heir. So creating a global tokenized evangelical missionary community via a DAO made sense.
Evan Duffield, a “libertarian/anarchist” visionary, forked Bitcoin in January 2014 to make it instant and essentially free. He went away for a while, and DASH became a DAO.
200,000 US retailers, including Walmart and Barnes & Noble, now accept Dash as payment. This payment system works like a gift card.
Arden Goldstein, Dash's head of crypto, DAO, and blockchain marketing, claims Dash is the “first successful DAO.” It was founded in 2016 and disbanded after a hack, an Ethereum hard fork and much controversy. But what are the success metrics?
Crypto success is measured differently, says Goldstein. To achieve common goals, people must participate or be motivated in a healthy DAO. People are motivated to complete tasks in a successful DAO. And, crucially, when tasks get completed.
“Yes or no, 1 or 0, voting is not a new idea. The challenge is getting people to continue to participate and keep building a community.” A DAO motivates volunteers: Nothing keeps people from building. The DAO “philosophy is old news. You need skin in the game to play.”
MasterNodes must stake 1000 Dash. Those members are rewarded with DASH for marketing (and other tasks). It uses an outsourced team to onboard new users globally.
Joining a DAO is part of the fun of meeting crazy or “very active” people on Discord. No one gets fired (usually). If your work is noticed, you may be offered a full-time job.
DAO community members worldwide are rewarded for brand building. Dash is also a great product for developing countries with high inflation and undemocratic governments. The countries with the most Dash DAO members are Russia, Brazil, Venezuela, India, China, France, Italy, and the Philippines.
Grassroots activism makes this DAO work. A DAO is local. Venezuelans can't access Dash.org, so DAO members help them use a VPN. DAO members are investors, fervent evangelicals, and local product experts.
Every month, proposals and grant applications are voted on via the Dash platform. However, the DAO may decide not to fund you. For example, the DAO once hired a PR firm, but the community complained about the lack of press coverage. This raises a great question: How are real-world contractual obligations met by a DAO?
Does the DASH DAO work?
“I see the DAO defund projects I thought were valuable,” Goldstein says. Despite working full-time, I must submit a funding proposal. “Much faster than other companies I've worked on,” he says.
Dash DAO is a headless beast. Ryan Taylor is the CEO of the company overseeing the DASH Core Group project.
The issue is that “we don't know who has the most tokens [...] because we don't know who our customers are.” As a result, “the loudest voices usually don't have the most MasterNodes and aren't the most invested.”
Goldstein, the only female in the DAO, says she worked hard. “I was proud of the DAO when I made the logo pink for a day and got great support from the men.” This has yet to entice a major influx of female DAO members.
Many obstacles stand in the way of utopian dreams.
Governance problems remain
And what about major token holders behaving badly?
In early February, a heated crypto Twitter debate raged on about inclusion, diversity, and cancel culture in relation to decentralized projects. In this case, the question was how a DAO addresses alleged inappropriate behavior.
In a corporation, misconduct can result in termination. In a DAO, founders usually hold a large number of tokens and the keys to the blockchain (multisignature) or otherwise.
Brantly Millegan, the director of operations of Ethereum Name Service (ENS), made disparaging remarks about the LGBTQ community and other controversial topics. The screenshotted comments were made in 2016 and brought to the ENS board's attention in early 2022.
His contract with ENS has expired. But what of his large DAO governance token holdings?
Members of the DAO proposed a motion to remove Millegan from the DAO. His “delegated” votes net 370,000. He was and is the DAO's largest delegate.
What if he had refused to accept the DAO's decision?
Freuden says the answer is not so simple.
“Can a DAO kick someone out who built the project?”
The original mission “should be dissolved” if it no longer exists. “Does a DAO fail and return the money? They must r eturn the money with interest if the marriage fails.”
Before an IPO, VCs might try to remove a problematic CEO.
While DAOs use treasury as a governance mechanism, it is usually controlled (at least initially) by the original project creators. Or, in the case of Uniswap, the venture capital firm a16z has so much voting power that it has delegated it to student-run blockchain organizations.
So, can DAOs really work at scale? How to evolve voting paradigms beyond token holdings?
The whale token holder issue has some solutions. Multiple tokens, such as a utility token on top of a governance token, and quadratic voting for whales, are now common. Other safeguards include multisignature blockchain keys and decision time locks that allow for any automated decision to be made. The structure of each DAO will depend on the assets at stake.
In reality, voter turnout is often a bigger issue.
Is DAO governance scalable?
Many DAOs have low participation. Due to a lack of understanding of technology, apathy, or busy lives. “The bigger the DAO, the fewer voters who vote,” says Freuden.
Freuden's report cites British anthropologist Dunbar's Law, who argued that people can only maintain about 150 relationships.
"As the DAO grows in size, the individual loses influence because they perceive their voting power as being diminished or insignificant. The Ringelmann Effect and Dunbar's Rule show that as a group grows in size, members become lazier, disenfranchised, and detached.
Freuden says a DAO requires “understanding human relationships.” He believes DAOs work best as investment funds rooted in Cryptoland and small in scale. In just three weeks, SyndicateDAO enabled the creation of 450 new investment group DAOs.
Due to SEC regulations, FlamingoDAO, a famous NFT curation investment DAO, could only have 100 investors. The “LAO” is a member-directed venture capital fund and a US LLC. To comply with US securities law, they only allow 100 members with a 120ETH minimum staking contribution.
But how did FlamingoDAO make investment decisions? How often did all 70 members vote? Art and NFTs are highly speculative.
So, investment DAOs are thought to work well in a small petri dish environment. This is due to a crypto-native club's pooled capital (maximum 7% per member) and crowdsourced knowledge.
While scalability is a concern, each DAO will operate differently depending on the goal, technology stage, and personalities. Meetups and hackathons are common ways for techies to collaborate on a cause or test an idea. But somebody still organizes the hack.
Holographic consensus voting
But clever people are working on creative solutions to every problem.
Miller of DAOplatform.io cites DXdao as a successful DAO. Decentralized product and service creator DXdao runs the DAO entirely on-chain. “You earn voting rights by contributing to the community.”
DXdao, a DAOstack fork, uses holographic consensus, a voting algorithm invented by DAOstack founder Matan Field. The system lets a random or semi-random subset make group-wide decisions.
By acting as a gatekeeper for voters, DXdao's Luke Keenan explains that “a small predictions market economy emerges around the likely outcome of a proposal as tokens are staked on it.” Also, proposals that have been financially boosted have fewer requirements to be successful, increasing system efficiency.” DXdao “makes decisions by removing voting power as an economic incentive.”
Field explains that holographic consensus “does not require a quorum to render a vote valid.”
“Rather, it provides a parallel process. It is a game played (for profit) by ‘predictors' who make predictions about whether or not a vote will be approved by the voters. The voting process is valid even when the voting quorum is low if enough stake is placed on the outcome of the vote.
“In other words, a quorum is not a scalable DAO governance strategy,” Field says.
You don't need big votes on everything. If only 5% vote, fine. To move significant value or make significant changes, you need a longer voting period (say 30 days) and a higher quorum,” says Miller.
Clearly, DAOs are maturing. The emphasis is on tools like Orca and processes that delegate power to smaller sub-DAOs, committees, and working groups.
Miller also claims that “studies in psychology show that rewarding people too much for volunteering disincentivizes them.” So, rather than giving out tokens for every activity, you may want to offer symbolic rewards like POAPs or contributor levels.
“Free lunches are less rewarding. Random rewards can boost motivation.”
Culture and motivation
DAOs (and Web3 in general) can give early adopters a sense of ownership. In theory, they encourage early participation and bootstrapping before network effects.
"A double-edged sword," says Goldstein. In the developing world, they may not be fully scalable.
“There must always be a leader,” she says. “People won't volunteer if they don't want to.”
DAO members sometimes feel entitled. “They are not the boss, but they think they should be able to see my calendar or get a daily report,” Goldstein gripes. Say, “I own three MasterNodes and need to know X, Y, and Z.”
In most decentralized projects, strong community leaders are crucial to influencing culture.
Freuden says “the DAO's community builder is the cryptoland influencer.” They must “disseminate the DAO's culture, cause, and rally the troops” in English, not tech.
They must keep members happy.
So the community builder is vital. Building a community around a coin that promises riches is simple, but keeping DAO members motivated is difficult.
It's a human job. But tools like SourceCred or coordinate that measure contributions and allocate tokens are heavily marketed. Large growth funds/community funds/grant programs are common among DAOs.
The Future?
Onboarding, committed volunteers, and an iconic community builder may be all DAOs need.
It takes a DAO just one day to bring together a passionate (and sometimes obsessive) community. For organizations with a common goal, managing stakeholder expectations is critical.
A DAO's core values are community and cause, not scalable governance. “DAOs will work at scale like gaming communities, but we will have sub-DAOs everywhere like committees,” says Freuden.
So-called holographic consensuses “can handle, in principle, increasing rates of proposals by turning this tension between scale and resilience into an economical cost,” Field writes. Scalability is not guaranteed.
The DAO's key innovation is the fragmented workplace. “Voting is a subset of engagement,” says Freuden. DAO should allow for permissionless participation and engagement. DAOs allow for remote work.”
In 20 years, DAOs may be the AI-powered self-organizing concept. That seems far away now. But a new breed of productivity coordination organisms is maturing.
Jumanne Rajabu Mtambalike
3 years ago
10 Years of Trying to Manage Time and Improve My Productivity.
I've spent the last 10 years of my career mastering time management. I've tried different approaches and followed multiple people and sources. My knowledge is summarized.
Great people, including entrepreneurs, master time management. I learned time management in college. I was studying Computer Science and Finance and leading Tanzanian students in Bangalore, India. I had 24 hours per day to do this and enjoy campus. I graduated and received several awards. I've learned to maximize my time. These tips and tools help me finish quickly.
Eisenhower-Box
I don't remember when I read the article. James Clear, one of my favorite bloggers, introduced me to the Eisenhower Box, which I've used for years. Eliminate waste to master time management. By grouping your activities by importance and urgency, the tool helps you prioritize what matters and drop what doesn't. If it's urgent, do it. Delegate if it's urgent but not necessary. If it's important but not urgent, reschedule it; otherwise, drop it. I integrated the tool with Trello to manage my daily tasks. Since 2007, I've done this.
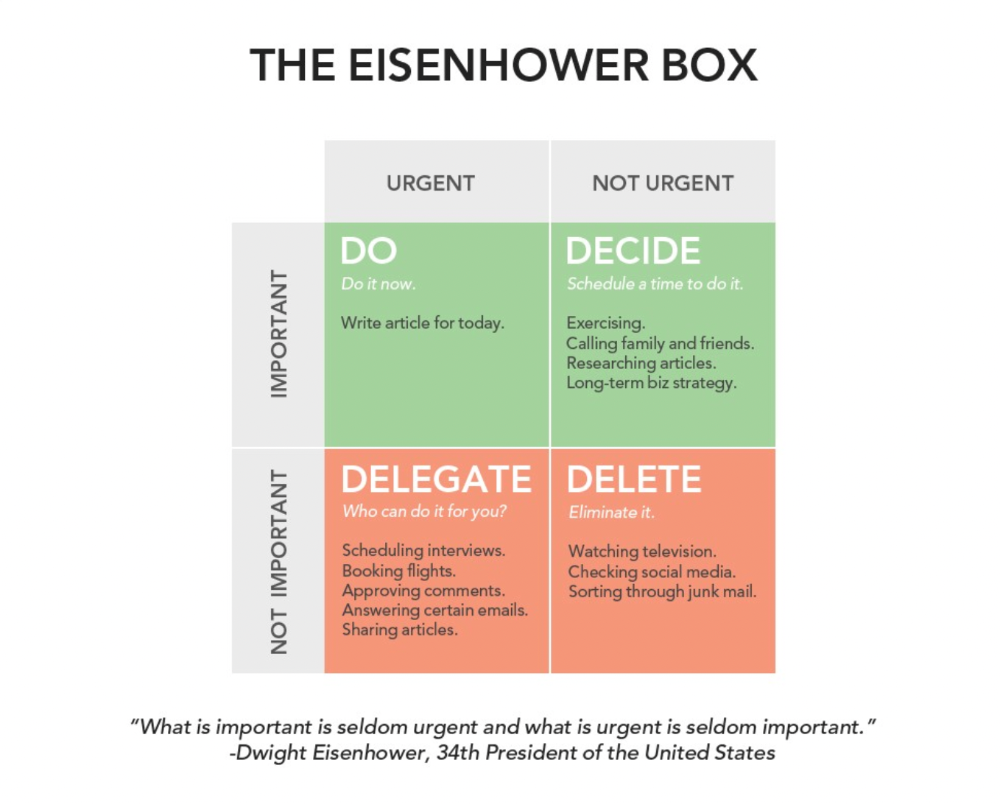
James Clear's article mentions Eisenhower Box.
Essentialism rules
Greg McKeown's book Essentialism introduced me to disciplined pursuit of less. I once wrote about this. I wasn't sure what my career's real opportunities and distractions were. A non-essentialist thinks everything is essential; you want to be everything to everyone, and your life lacks satisfaction. Poor time management starts it all. Reading and applying this book will change your life.
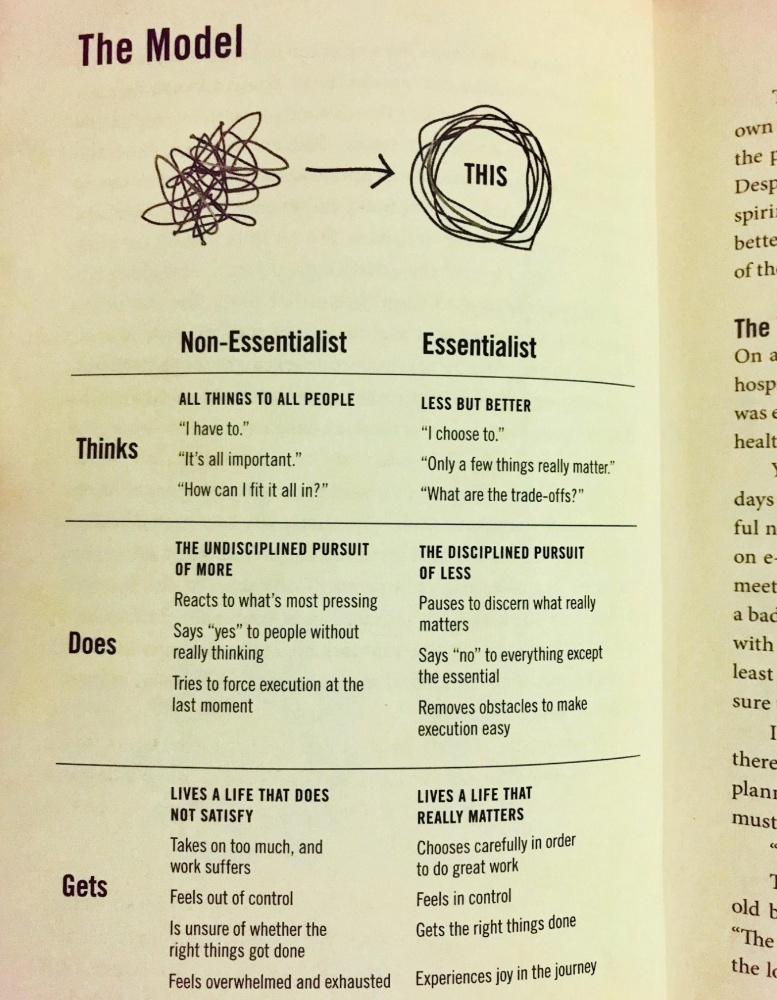
Essential vs non-essential
Life Calendar
Most of us make corporate calendars. Peter Njonjo, founder of Twiga Foods, said he manages time by putting life activities in his core calendars. It includes family retreats, weddings, and other events. He joked that his wife always complained to him to avoid becoming a calendar item. It's key. "Time Masters" manages life's four burners, not just work and corporate life. There's no "work-life balance"; it's life.
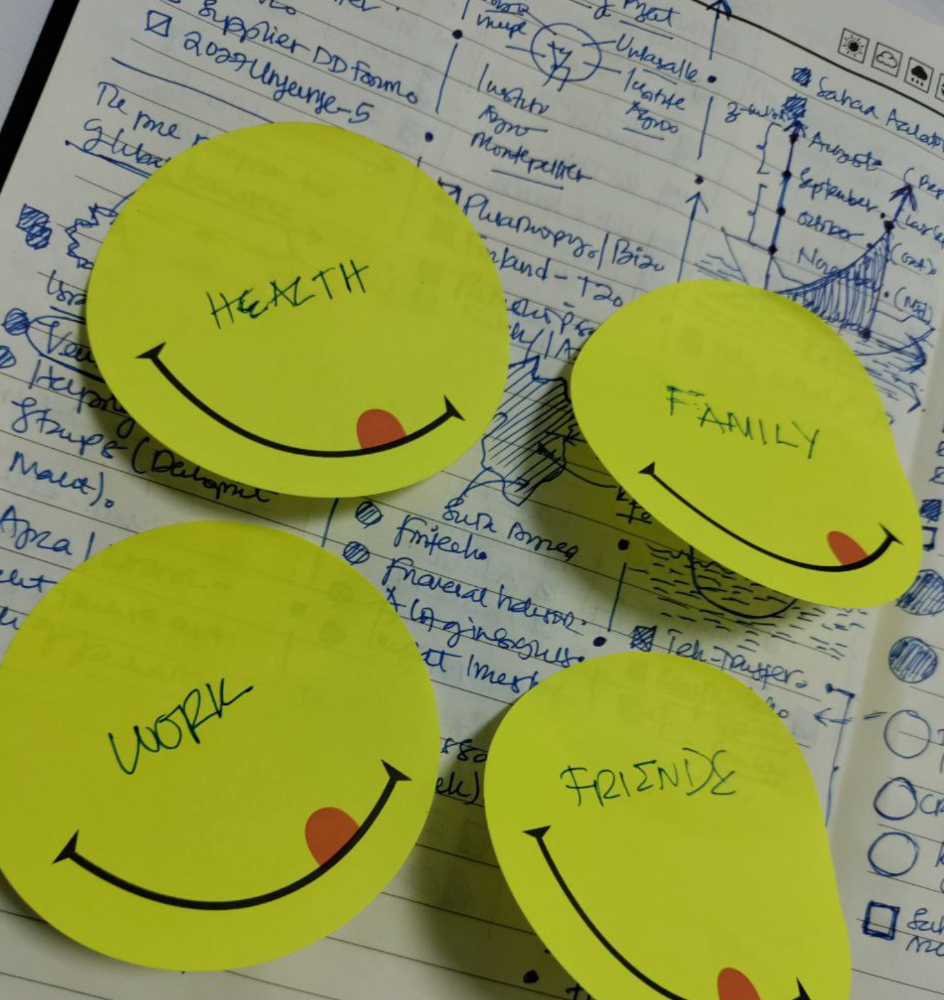
Health, Family, Work, and Friends.
The Brutal No
In a culture where people want to look good, saying "NO" to a favor request seems rude. In reality, the crime is breaking a promise. "Time Masters" have mastered "NO". More "YES" means less time, and more "NO" means more time for tasks and priorities. Brutal No doesn't mean being mean to your coworkers; it means explaining kindly and professionally that you have other priorities.
To-Do vs. MITs
Most people are productive with a routine to-do list. You can't be effective by just checking boxes on a To-do list. When was the last time you completed all of your daily tasks? Never. You must replace the to-do list with Most Important Tasks (MITs). MITs allow you to focus on the most important tasks on your list. You feel progress and accomplishment when you finish these tasks. MITs don't include ad-hoc emails, meetings, etc.
Journal Mapped
Most people don't journal or plan their day in the developing South. I've learned to plan my day in my journal over time. I have multiple sections on one page: MITs (things I want to accomplish that day), Other Activities (stuff I can postpone), Life (health, faith, and family issues), and Pop-Ups (things that just pop up). I leave the next page blank for notes. I reflected on the blocks to identify areas to improve the next day. You will have bad days, but at least you'll realize it was due to poor time management.
Buy time/delegate
Time or money? When you make enough money, you lose time to make more. The smart buy "Time." I resisted buying other people's time for years. I regret not hiring an assistant sooner. Learn to buy time from others and pay for time-consuming tasks. Sometimes you think you're saving money by doing things yourself, but you're actually losing money.
This post is a summary. See the full post here.

Zuzanna Sieja
3 years ago
In 2022, each data scientist needs to read these 11 books.

Non-technical talents can benefit data scientists in addition to statistics and programming.
As our article 5 Most In-Demand Skills for Data Scientists shows, being business-minded is useful. How can you get such a diverse skill set? We've compiled a list of helpful resources.
Data science, data analysis, programming, and business are covered. Even a few of these books will make you a better data scientist.
Ready? Let’s dive in.
Best books for data scientists
1. The Black Swan
Author: Nassim Taleb
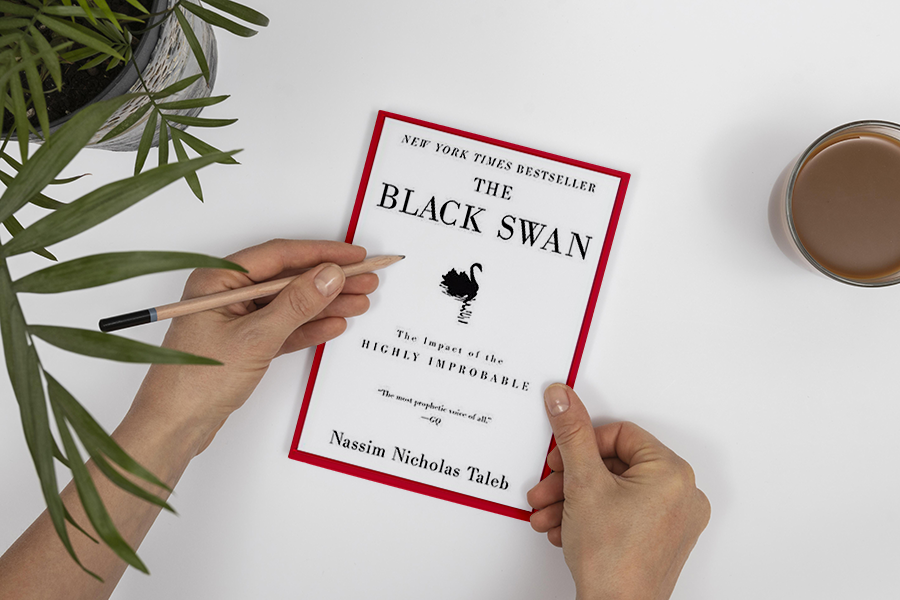
First, a less obvious title. Nassim Nicholas Taleb's seminal series examines uncertainty, probability, risk, and decision-making.
Three characteristics define a black swan event:
It is erratic.
It has a significant impact.
Many times, people try to come up with an explanation that makes it seem more predictable than it actually was.
People formerly believed all swans were white because they'd never seen otherwise. A black swan in Australia shattered their belief.
Taleb uses this incident to illustrate how human thinking mistakes affect decision-making. The book teaches readers to be aware of unpredictability in the ever-changing IT business.
Try multiple tactics and models because you may find the answer.
2. High Output Management
Author: Andrew Grove
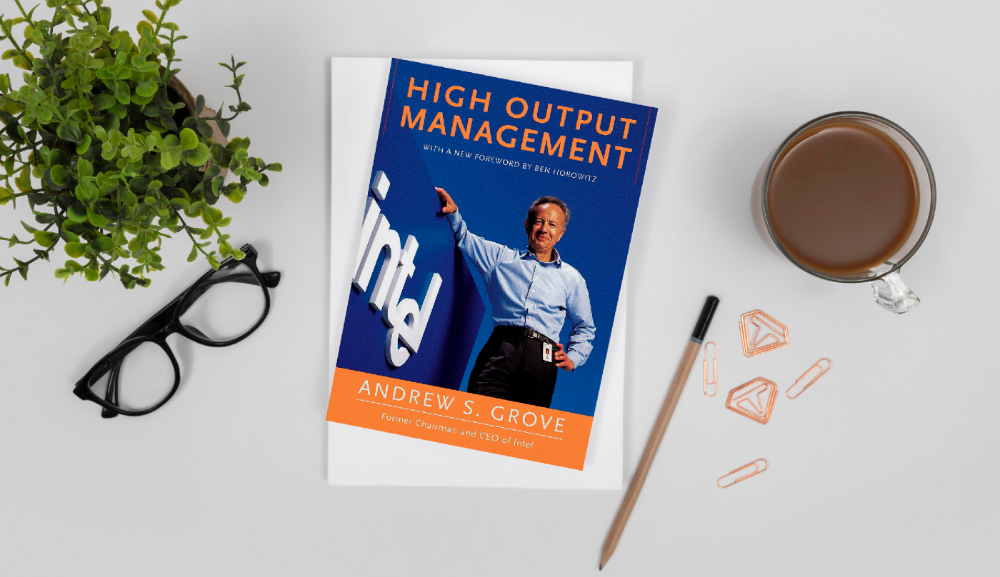
Intel's former chairman and CEO provides his insights on developing a global firm in this business book. We think Grove would choose “management” to describe the talent needed to start and run a business.
That's a skill for CEOs, techies, and data scientists. Grove writes on developing productive teams, motivation, real-life business scenarios, and revolutionizing work.
Five lessons:
Every action is a procedure.
Meetings are a medium of work
Manage short-term goals in accordance with long-term strategies.
Mission-oriented teams accelerate while functional teams increase leverage.
Utilize performance evaluations to enhance output.
So — if the above captures your imagination, it’s well worth getting stuck in.
3. The Hard Thing About Hard Things: Building a Business When There Are No Easy Answers
Author: Ben Horowitz
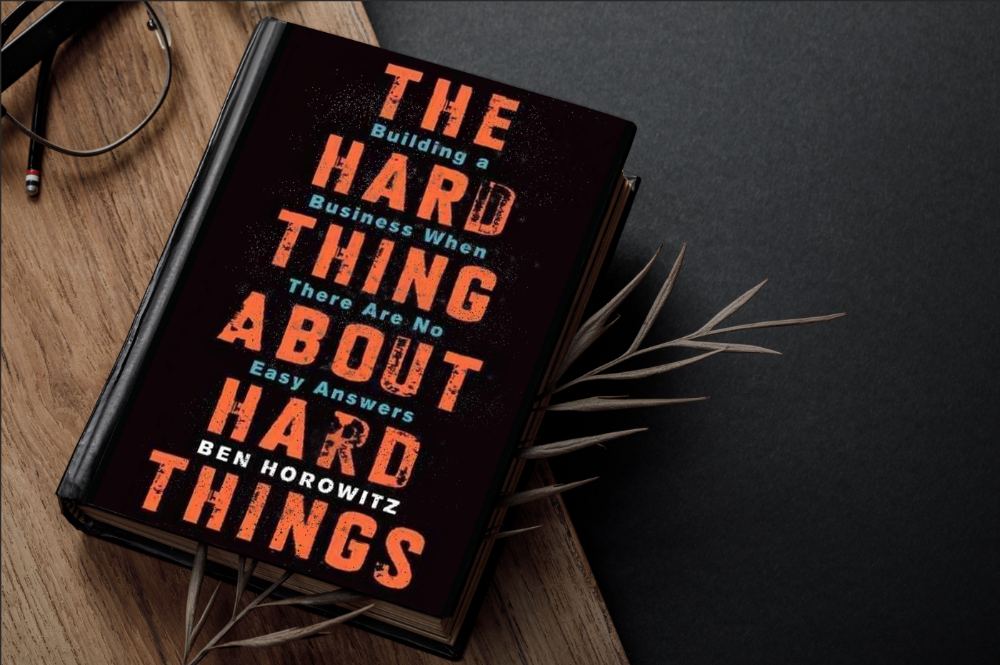
Few realize how difficult it is to run a business, even though many see it as a tremendous opportunity.
Business schools don't teach managers how to handle the toughest difficulties; they're usually on their own. So Ben Horowitz wrote this book.
It gives tips on creating and maintaining a new firm and analyzes the hurdles CEOs face.
Find suggestions on:
create software
Run a business.
Promote a product
Obtain resources
Smart investment
oversee daily operations
This book will help you cope with tough times.
4. Obviously Awesome: How to Nail Product Positioning
Author: April Dunford
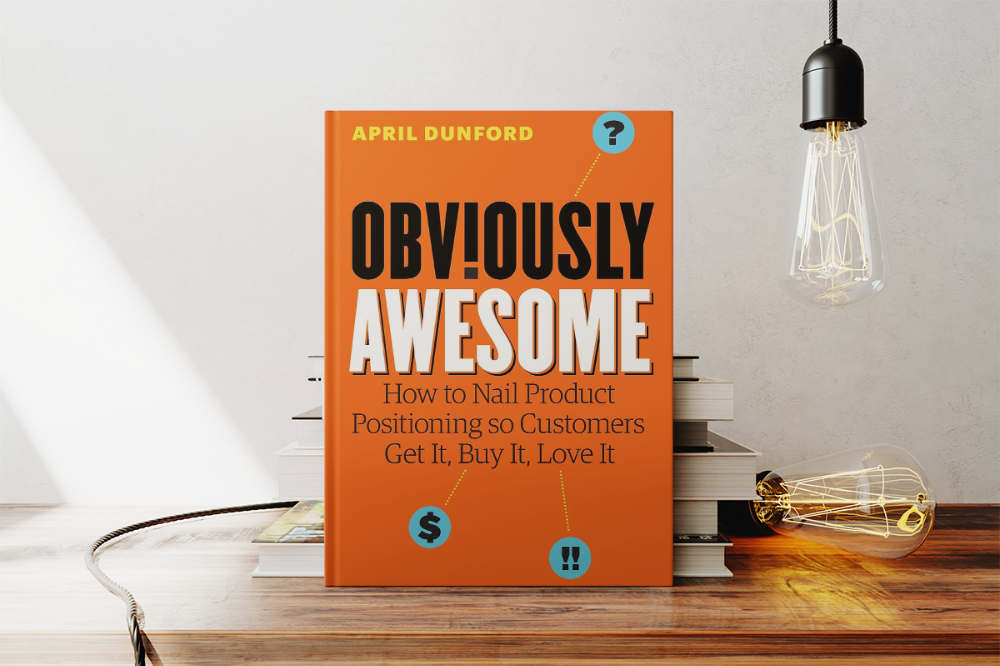
Your job as a data scientist is a product. You should be able to sell what you do to clients. Even if your product is great, you must convince them.
How to? April Dunford's advice: Her book explains how to connect with customers by making your offering seem like a secret sauce.
You'll learn:
Select the ideal market for your products.
Connect an audience to the value of your goods right away.
Take use of three positioning philosophies.
Utilize market trends to aid purchasers
5. The Mom test
Author: Rob Fitzpatrick

The Mom Test improves communication. Client conversations are rarely predictable. The book emphasizes one of the most important communication rules: enquire about specific prior behaviors.
Both ways work. If a client has suggestions or demands, listen carefully and ensure everyone understands. The book is packed with client-speaking tips.
6. Introduction to Machine Learning with Python: A Guide for Data Scientists
Authors: Andreas C. Müller, Sarah Guido
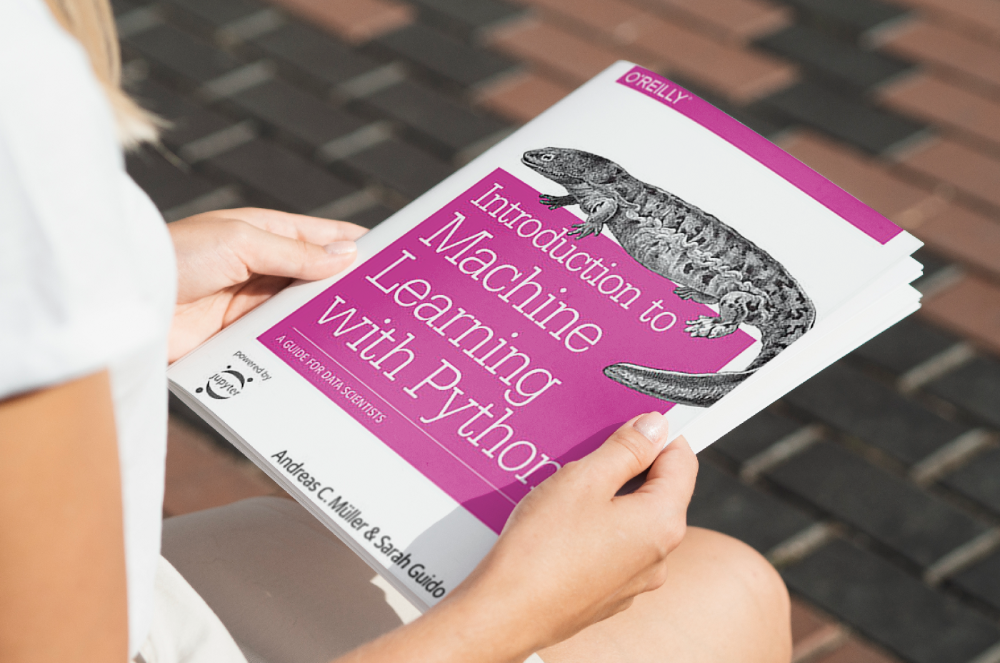
Now, technical documents.
This book is for Python-savvy data scientists who wish to learn machine learning. Authors explain how to use algorithms instead of math theory.
Their technique is ideal for developers who wish to study machine learning basics and use cases. Sci-kit-learn, NumPy, SciPy, pandas, and Jupyter Notebook are covered beyond Python.
If you know machine learning or artificial neural networks, skip this.
7. Python Data Science Handbook: Essential Tools for Working with Data
Author: Jake VanderPlas
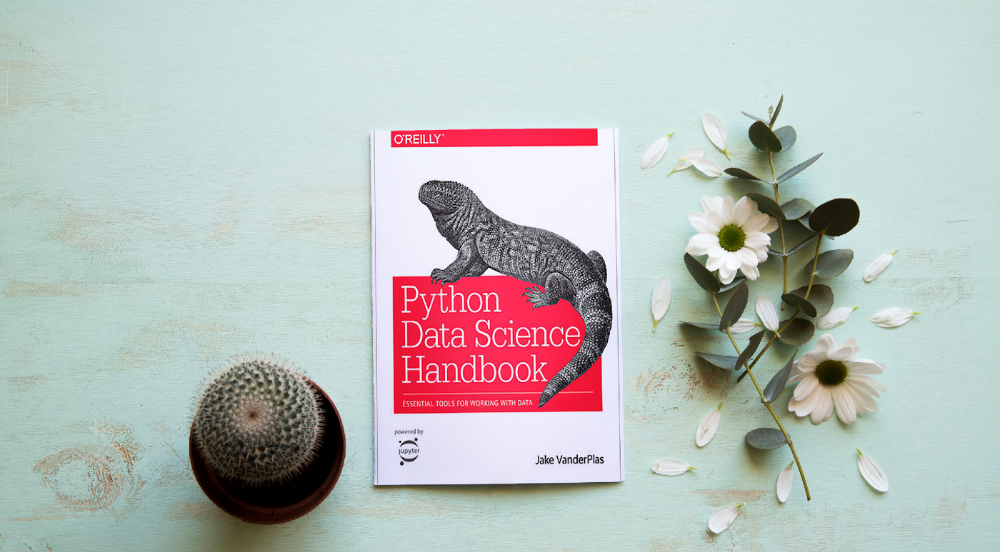
Data work isn't easy. Data manipulation, transformation, cleansing, and visualization must be exact.
Python is a popular tool. The Python Data Science Handbook explains everything. The book describes how to utilize Pandas, Numpy, Matplotlib, Scikit-Learn, and Jupyter for beginners.
The only thing missing is a way to apply your learnings.
8. Python for Data Analysis: Data Wrangling with Pandas, NumPy, and IPython
Author: Wes McKinney
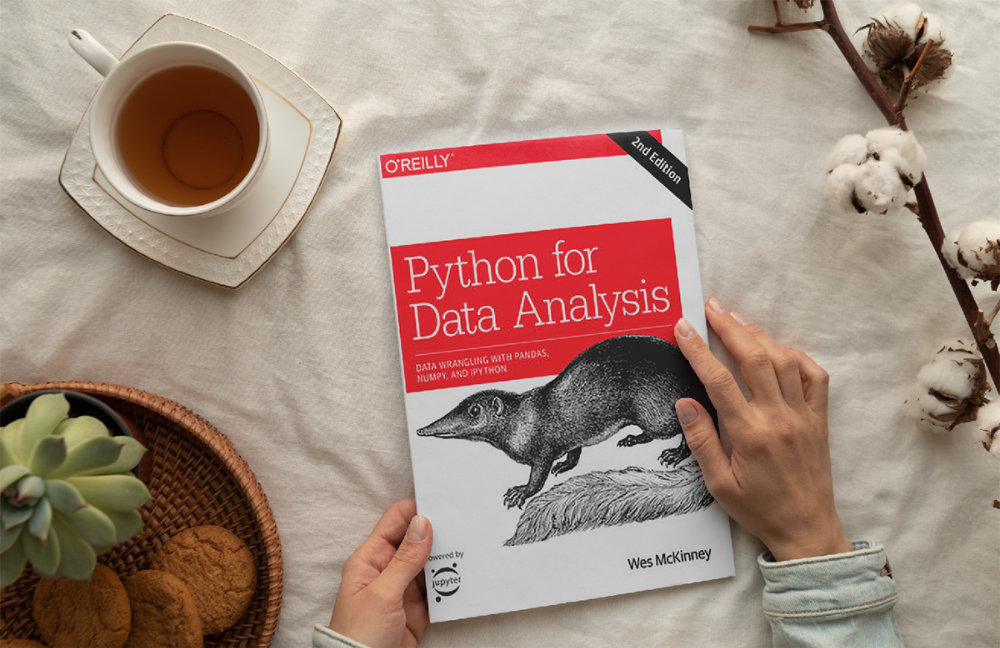
The author leads you through manipulating, processing, cleaning, and analyzing Python datasets using NumPy, Pandas, and IPython.
The book's realistic case studies make it a great resource for Python or scientific computing beginners. Once accomplished, you'll uncover online analytics, finance, social science, and economics solutions.
9. Data Science from Scratch
Author: Joel Grus
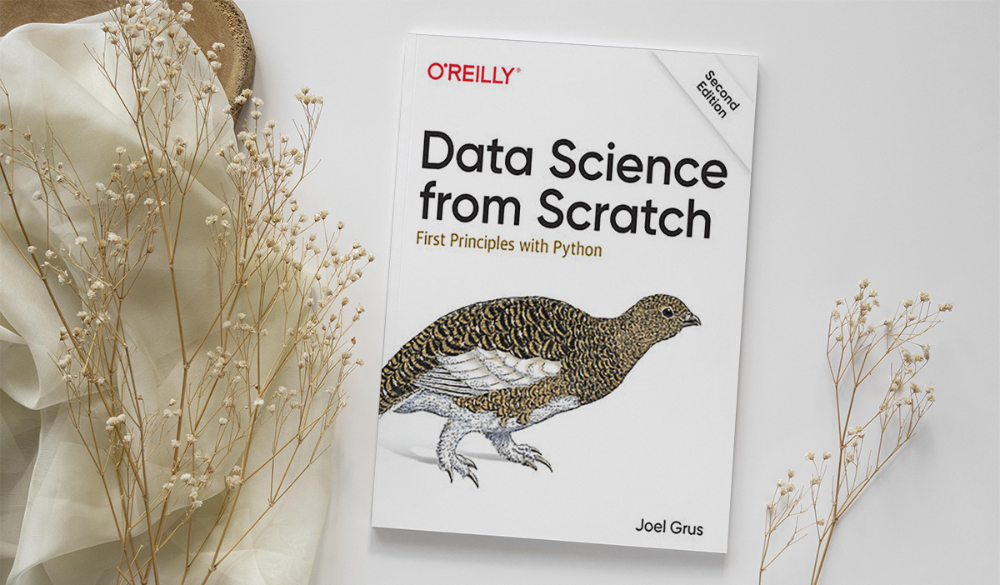
Here's a title for data scientists with Python, stats, maths, and algebra skills (alongside a grasp of algorithms and machine learning). You'll learn data science's essential libraries, frameworks, modules, and toolkits.
The author works through all the key principles, providing you with the practical abilities to develop simple code. The book is appropriate for intermediate programmers interested in data science and machine learning.
Not that prior knowledge is required. The writing style matches all experience levels, but understanding will help you absorb more.
10. Machine Learning Yearning
Author: Andrew Ng
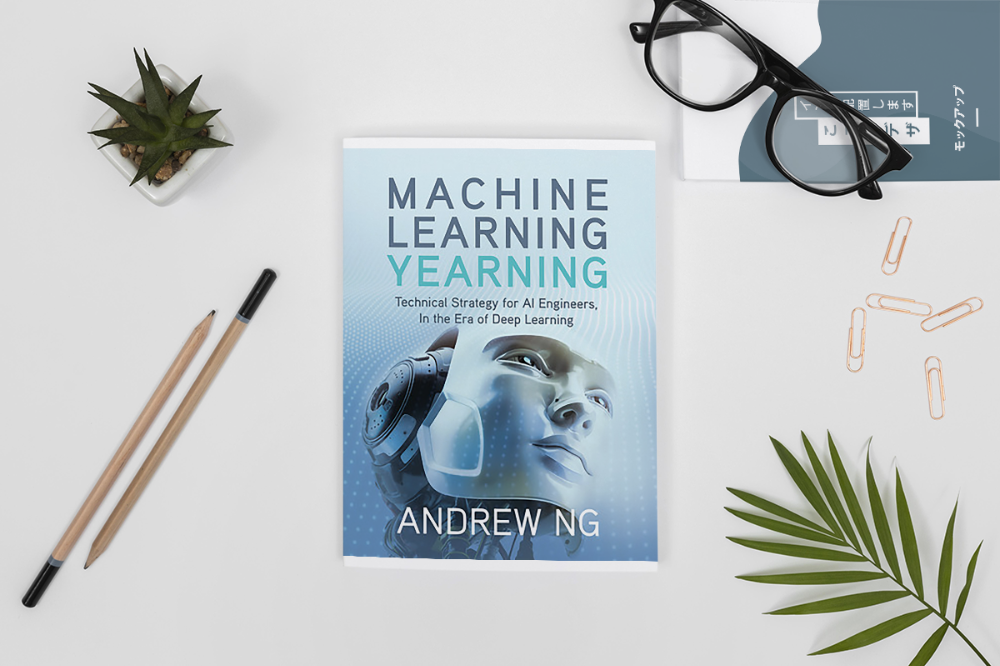
Andrew Ng is a machine learning expert. Co-founded and teaches at Stanford. This free book shows you how to structure an ML project, including recognizing mistakes and building in complex contexts.
The book delivers knowledge and teaches how to apply it, so you'll know how to:
Determine the optimal course of action for your ML project.
Create software that is more effective than people.
Recognize when to use end-to-end, transfer, and multi-task learning, and how to do so.
Identifying machine learning system flaws
Ng writes easy-to-read books. No rigorous math theory; just a terrific approach to understanding how to make technical machine learning decisions.
11. Deep Learning with PyTorch Step-by-Step
Author: Daniel Voigt Godoy
The last title is also the most recent. The book was revised on 23 January 2022 to discuss Deep Learning and PyTorch, a Python coding tool.
It comprises four parts:
Fundamentals (gradient descent, training linear and logistic regressions in PyTorch)
Machine Learning (deeper models and activation functions, convolutions, transfer learning, initialization schemes)
Sequences (RNN, GRU, LSTM, seq2seq models, attention, self-attention, transformers)
Automatic Language Recognition (tokenization, embeddings, contextual word embeddings, ELMo, BERT, GPT-2)
We admire the book's readability. The author avoids difficult mathematical concepts, making the material feel like a conversation.
Is every data scientist a humanist?
Even as a technological professional, you can't escape human interaction, especially with clients.
We hope these books will help you develop interpersonal skills.