


More on Lifestyle

Stephen Rivers
3 years ago
Because of regulations, the $3 million Mercedes-AMG ONE will not (officially) be available in the United States or Canada.
We asked Mercedes to clarify whether "customers" refers to people who have expressed interest in buying the AMG ONE but haven't made a down payment or paid in full for a production slot, and a company spokesperson told that it's the latter – "Actual customers for AMG ONE in the United States and Canada."
The Mercedes-AMG ONE has finally arrived in manufacturing form after numerous delays. This may be the most complicated and magnificent hypercar ever created, but according to Mercedes, those roads will not be found in the United States or Canada.
Despite all of the well-deserved excitement around the gorgeous AMG ONE, there was no word on when US customers could expect their cars. Our Editor-in-Chief became aware of this and contacted Mercedes to clarify the matter. Mercedes-hypercar AMG's with the F1-derived 1,049 HP 1.6-liter V6 engine will not be homologated for the US market, they've confirmed.
Mercedes has informed its customers in the United States and Canada that the ONE will not be arriving to North America after all, as of today, June 1, 2022. The whole text of the letter is included below, so sit back and wait for Mercedes to explain why we (or they) won't be getting (or seeing) the hypercar. Mercedes claims that all 275 cars it wants to produce have already been reserved, with net pricing in Europe starting at €2.75 million (about US$2.93 million at today's exchange rates), before country-specific taxes.
"The AMG-ONE was created with one purpose in mind: to provide a straight technology transfer of the World Championship-winning Mercedes-AMG Petronas Formula 1 E PERFORMANCE drive unit to the road." It's the first time a complete Formula 1 drive unit has been integrated into a road car.
Every component of the AMG ONE has been engineered to redefine high performance, with 1,000+ horsepower, four electric motors, and a blazing top speed of more than 217 mph. While the engine's beginnings are in competition, continuous research and refinement has left us with a difficult choice for the US market.
We determined that following US road requirements would considerably damage its performance and overall driving character in order to preserve the distinctive nature of its F1 powerplant. We've made the strategic choice to make the automobile available for road use in Europe, where it complies with all necessary rules."
If this is the first time US customers have heard about it, which it shouldn't be, we understand if it's a bit off-putting. The AMG ONE could very probably be Mercedes' final internal combustion hypercar of this type.
Nonetheless, we wouldn't be surprised if a few make their way to the United States via the federal government's "Show and Display" exemption provision. This legislation permits the importation of automobiles such as the AMG ONE, but only for a total of 2,500 miles per year.
The McLaren Speedtail, the Koenigsegg One:1, and the Bugatti EB110 are among the automobiles that have been imported under this special rule. We just hope we don't have to wait too long to see the ONE in the United States.

Will Lockett
2 years ago
There Is A New EV King in Town

McMurtry Spéirling outperforms Tesla in speed and efficiency.
EVs were ridiculously slow for decades. However, the 2008 Tesla Roadster revealed that EVs might go extraordinarily fast. The Tesla Model S Plaid and Rimac Nevera are the fastest-accelerating road vehicles, despite combustion-engined road cars dominating the course. A little-known firm beat Tesla and Rimac in the 0-60 race, beat F1 vehicles on a circuit, and boasts a 350-mile driving range. The McMurtry Spéirling is completely insane.
Mat Watson of CarWow, a YouTube megastar, was recently handed a Spéirling and access to Silverstone Circuit (view video above). Mat ran a quarter-mile on Silverstone straight with former F1 driver Max Chilton. The little pocket-rocket automobile touched 100 mph in 2.7 seconds, completed the quarter mile in 7.97 seconds, and hit 0-60 in 1.4 seconds. When looking at autos quickly, 0-60 times can seem near. The Tesla Model S Plaid does 0-60 in 1.99 seconds, which is comparable to the Spéirling. Despite the meager statistics, the Spéirling is nearly 30% faster than Plaid!
My vintage VW Golf 1.4s has an 8.8-second 0-60 time, whereas a BMW Z4 3.0i is 30% faster (with a 0-60 time of 6 seconds). I tried to beat a Z4 off the lights in my Golf, but the Beamer flew away. If they challenge the Spéirling in a Model S Plaid, they'll feel as I did. Fast!
Insane quarter-mile drag time. Its road car record is 7.97 seconds. A Dodge Demon, meant to run extremely fast quarter miles, finishes so in 9.65 seconds, approximately 20% slower. The Rimac Nevera's 8.582-second quarter-mile record was miles behind drag racing. This run hampered the Spéirling. Because it was employing gearing that limited its top speed to 150 mph, it reached there in a little over 5 seconds without accelerating for most of the quarter mile! McMurtry can easily change the gearing, making the Spéirling run quicker.
McMurtry did this how? First, the Spéirling is a tiny single-seater EV with a 60 kWh battery pack, making it one of the lightest EVs ever. The 1,000-hp Spéirling has more than one horsepower per kg. The Nevera has 0.84 horsepower per kg and the Plaid 0.44.
However, you cannot simply construct a car light and power it. Instead of accelerating, it would spin. This makes the Spéirling a fan car. Its huge fans create massive downforce. These fans provide the Spéirling 2 tonnes of downforce while stationary, so you could park it on the ceiling. Its fast 0-60 time comes from its downforce, which lets it deliver all that power without wheel spin.
It also possesses complete downforce at all speeds, allowing it to tackle turns faster than even race vehicles. Spéirlings overcame VW IDRs and F1 cars to set the Goodwood Hill Climb record (read more here). The Spéirling is a dragstrip winner and track dominator, unlike the Plaid and Nevera.
The Spéirling is astonishing for a single-seater. Fan-generated downforce is more efficient than wings and splitters. It also means the vehicle has very minimal drag without the fan. The Spéirling can go 350 miles per charge (WLTP) or 20-30 minutes at full speed on a track despite its 60 kWh battery pack. The G-forces would hurt your neck before the battery died if you drove around a track for longer. The Spéirling can charge at over 200 kW in about 30 minutes. Thus, driving to track days, having fun, and returning is possible. Unlike other high-performance EVs.
Tesla, Rimac, or Lucid will struggle to defeat the Spéirling. They would need to build a fan automobile because adding power to their current vehicle would make it uncontrollable. The EV and automobile industries now have a new, untouchable performance king.
Josh Chesler
3 years ago
10 Sneaker Terms Every Beginner Should Know
So you want to get into sneakers? Buying a few sneakers and figuring it out seems simple. Then you miss out on the weekend's instant-sellout releases, so you head to eBay, Twitter, or your local sneaker group to see what's available, since you're probably not ready to pay Flight Club prices just yet.
That's when you're bombarded with new nicknames, abbreviations, and general sneaker slang. It would take months to explain every word and sneaker, so here's a starter kit of ten simple terms to get you started. (Yeah, mostly Jordan. Does anyone really start with Kith or Nike SB?)
10. Colorways
Colorways are a common term in fashion, design, and other visual fields. It's just the product's color scheme. In the case of sneakers, the colorway is often as important as the actual model. Are this year's "Chicago" Air Jordan 1s more durable than last year's "Black/Gum" colorway? Because of their colorway and rarity, the Chicagos are worth roughly three pairs of the Black/Gum kicks.
Pro Tip: A colorway with a well-known nickname is almost always worth more than one without, and the same goes for collaborations.
9. Beaters
A “beater” is a well-worn, likely older model of shoe that has significant wear and tear on it. Rarely sold with the original box or extra laces, beaters rarely sell for much. Unlike most “worn” sneakers, beaters are used for rainy days and the gym. It's exactly what it sounds like, a box full of beaters, and they're a good place to start if you're looking for some cheap old kicks.
Pro Tip: Know which shoes clean up nicely. The shape of lower top sneakers with wider profiles, like SB Dunk Lows and Air Jordan 3s, tends to hold better over time than their higher and narrower cousins.
8. Retro
In the world of Jordan Brand, a “Retro” release is simply a release (or re-release) of a colorway after the shoe model's initial release. For example, the original Air Jordan 7 was released in 1992, but the Bordeaux colorway was re-released in 2011 and recently (2015). An Air Jordan model is released every year, and while half of them are unpopular and unlikely to be Retroed soon, any of them could be re-released whenever Nike and Jordan felt like it.
Pro Tip: Now that the Air Jordan line has been around for so long, the model that tends to be heavily retroed in a year is whichever shoe came out 23 (Michael Jordan’s number during the prime of his career) years ago. The Air Jordan 6 (1991) got new colorways last year, the Air Jordan 7 this year, and more Air Jordan 8s will be released later this year and early next year (1993).
7. PP/Inv
In spite of the fact that eBay takes roughly 10% of the final price, many sneaker buyers and sellers prefer to work directly with PayPal. Selling sneakers for $100 via PayPal invoice or $100 via PayPal friends/family is common on social media. Because no one wants their eBay account suspended for promoting PayPal deals, many eBay sellers will simply state “Message me for a better price.”
Pro Tip: PayPal invoices protect buyers well, but gifting or using Google Wallet does not. Unless you're certain the seller is legitimate, only use invoiced goods/services payments.
6. Yeezy
Kanye West and his sneakers are known as Yeezys. The rapper's first two Yeezys were made by Nike before switching to Adidas. Everything Yeezy-related will be significantly more expensive (and therefore have significantly more fakes made). Not only is the Nike Air Yeezy 2 “Red October” one of the most sought-after sneakers, but the Yeezy influence can be seen everywhere.
Pro Tip: If you're going to buy Yeezys, make sure you buy them from a reputable retailer or reseller. With so many fakes out there, it's not worth spending a grand on something you're not 100% sure is real.
5. GR/Limited
Regardless of how visually repulsive, uncomfortable, and/or impractical a sneaker is, if it’s rare enough, people will still want it. GR stands for General Release, which means they're usually available at retail. Reselling a “Limited Edition” release is costly. Supply and demand, but in this case, the limited supply drives up demand. If you want to get some of the colorways made for rappers, NBA players (Player Exclusive or PE models), and other celebrities, be prepared to pay a premium.
Pro Tip: Limited edition sneakers, like the annual Doernbecher Freestyle sneakers Nike creates with kids from Portland's Doernbecher Children's Hospital, will always be more expensive and limited. Or, you can use automated sneaker-buying software.
4. Grails
A “grail” is a pair of sneakers that someone desires above all others. To obtain their personal grails, people are willing to pay significantly more than the retail price. There doesn't have to be any rhyme or reason why someone chose a specific pair as their grails.
Pro Tip: For those who don't have them, the OG "Bred" or "Royal" Air Jordan 1s, the "Concord" Air Jordan 11s, etc., are all grails.
3. Bred
Anything released in “Bred” (black and red) will sell out quickly. Most resale Air Jordans (and other sneakers) come in the Bred colorway, which is a fan favorite. Bred is a good choice for a first colorway, especially on a solid sneaker silhouette.
Pro Tip: Apart from satisfying the world's hypebeasts, Bred sneakers will probably match a lot of your closet.
2. DS
DS = Deadstock = New. That's it. If something has been worn or tried on, it is no longer DS. Very Near Deadstock (VNDS) Pass As Deadstock It's a cute way of saying your sneakers have been worn but are still in good shape. In the sneaker world, “worn” means they are no longer new, but not too old or beat up.
Pro Tip: Ask for photos of any marks or defects to see what you’re getting before you buy used shoes, also find out if they come with the original box and extra laces, because that can be a sign that they’re in better shape.
1. Fake/Unauthorized
The words “Unauthorized,” “Replica,” “B-grades,” and “Super Perfect” all mean the shoes are fake. It means they aren't made by the actual company, no matter how close or how good the quality. If that's what you want, go ahead and get them. Do not wear them if you do not want the rest of the sneaker world to mock them.
Pro Tip: If you’re not sure if shoes are real or not, do a “Legit Check” on Twitter or Facebook. You'll get dozens of responses in no time.
You might also like

Mike Tarullo
3 years ago
Even In a Crazy Market, Hire the Best People: The "First Ten" Rules
Hiring is difficult, but you shouldn't compromise on team members. Or it may suggest you need to look beyond years in a similar role/function.
Every hire should be someone we'd want as one of our first ten employees.
If you hire such people, your team will adapt, initiate, and problem-solve, and your company will grow. You'll stay nimble even as you scale, and you'll learn from your colleagues.
If you only hire for a specific role or someone who can execute the job, you'll become a cluster of optimizers, and talent will depart for a more fascinating company. A startup is continually changing, therefore you want individuals that embrace it.
As a leader, establishing ideal conditions for talent and having a real ideology should be high on your agenda. You can't eliminate attrition, nor would you want to, but you can hire people who will become your company's leaders.
In my last four jobs I was employee 2, 5, 3, and 5. So while this is all a bit self serving, you’re the one reading my writing — and I have some experience with who works out in the first ten!
First, we'll examine what they do well (and why they're beneficial for startups), then what they don't, and how to hire them.
First 10 are:
Business partners: Because it's their company, they take care of whatever has to be done and have ideas about how to do it. You can rely on them to always put the success of the firm first because it is their top priority (company success is strongly connected with success for early workers). This approach will eventually take someone to leadership positions.
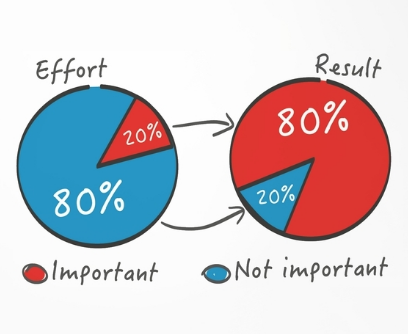
High Speed Learners: They process knowledge quickly and can reach 80%+ competency in a new subject matter rather quickly. A growing business that is successful tries new things frequently. We have all lost a lot of money and time on employees who follow the wrong playbook or who wait for someone else within the company to take care of them.
Autodidacts learn by trial and error, osmosis, networking with others, applying first principles, and reading voraciously (articles, newsletters, books, and even social media). Although teaching is wonderful, you won't have time.
Self-scaling: They figure out a means to deal with issues and avoid doing the grunt labor over the long haul, increasing their leverage. Great people don't keep doing the same thing forever; as they expand, they use automation and delegation to fill in their lower branches. This is a crucial one; even though you'll still adore them, you'll have to manage their scope or help them learn how to scale on their own.
Free Range: You can direct them toward objectives rather than specific chores. Check-ins can be used to keep them generally on course without stifling invention instead of giving them precise instructions because doing so will obscure their light.
When people are inspired, they bring their own ideas about what a firm can be and become animated during discussions about how to get there.
Novelty Seeking: They look for business and personal growth chances. Give them fresh assignments and new directions to follow around once every three months.
Here’s what the First Ten types may not be:
Domain specialists. When you look at their resumes, you'll almost certainly think they're unqualified. Fortunately, a few strategically positioned experts may empower a number of First Ten types by serving on a leadership team or in advising capacities.
Balanced. These people become very invested, and they may be vulnerable to many types of stress. You may need to assist them in managing their own stress and coaching them through obstacles. If you are reading this and work at Banza, I apologize for not doing a better job of supporting this. I need to be better at it.
Able to handle micromanagement with ease. People who like to be in charge will suppress these people. Good decision-making should be delegated to competent individuals. Generally speaking, if you wish to scale.
Great startup team members have versatility, learning, innovation, and energy. When we hire for the function, not the person, we become dull and staid. Could this person go to another department if needed? Could they expand two levels in a few years?
First Ten qualities and experience level may have a weak inverse association. People with 20+ years of experience who had worked at larger organizations wanted to try something new and had a growth mentality. College graduates may want to be told what to do and how to accomplish it so they can stay in their lane and do what their management asks.
Does the First Ten archetype sound right for your org? Cool, let’s go hiring. How will you know when you’ve found one?
They exhibit adaptive excellence, excelling at a variety of unrelated tasks. It could be hobbies or professional talents. This suggests that they will succeed in the next several endeavors they pursue.
Successful risk-taking is doing something that wasn't certain to succeed, sometimes more than once, and making it do so. It's an attitude.
Rapid Rise: They regularly change roles and get promoted. However, they don't leave companies when the going gets tough. Look for promotions at every stop and at least one position with three or more years of experience.
You can ask them:
Tell me about a time when you started from scratch or achieved success. What occurred en route? You might request a variety of tales from various occupations or even aspects of life. They ought to be energized by this.
What new skills have you just acquired? It is not required to be work-related. They must be able to describe it and unintentionally become enthusiastic about it.
Tell me about a moment when you encountered a challenge and had to alter your strategy. The core of a startup is reinventing itself when faced with obstacles.
Tell me about a moment when you eliminated yourself from a position at work. They've demonstrated they can permanently solve one issue and develop into a new one, as stated above.
Why do you want to leave X position or Y duty? These people ought to be moving forward, not backward, all the time. Instead, they will discuss what they are looking forward to visiting your location.
Any questions? Due to their inherent curiosity and desire to learn new things, they should practically never run out of questions. You can really tell if they are sufficiently curious at this point.
People who see their success as being the same as the success of the organization are the best-case team members, in any market. They’ll grow and change with the company, and always try to prioritize what matters. You’ll find yourself more energized by your work because you’re surrounded by others who are as well. Happy teambuilding!

DC Palter
3 years ago
Is Venture Capital a Good Fit for Your Startup?
5 VC investment criteria
I reviewed 200 startup business concepts last week. Brainache.
The enterprises sold various goods and services. The concepts were achingly similar: give us money, we'll produce a product, then get more to expand. No different from daily plans and pitches.
Most of those 200 plans sounded plausible. But 10% looked venture-worthy. 90% of startups need alternatives to venture finance.
With the success of VC-backed businesses and the growth of venture funds, a common misperception is that investors would fund any decent company idea. Finding investors that believe in the firm and founders is the key to funding.
Incorrect. Venture capital needs investing in certain enterprises. If your startup doesn't match the model, as most early-stage startups don't, you can revise your business plan or locate another source of capital.
Before spending six months pitching angels and VCs, make sure your startup fits these criteria.
Likely to generate $100 million in sales
First, I check the income predictions in a pitch deck. If it doesn't display $100M, don't bother.
The math doesn't work for venture financing in smaller businesses.
Say a fund invests $1 million in a startup valued at $5 million that is later acquired for $20 million. That's a win everyone should celebrate. Most VCs don't care.
Consider a $100M fund. The fund must reach $360M in 7 years with a 20% return. Only 20-30 investments are possible. 90% of the investments will fail, hence the 23 winners must return $100M-$200M apiece. $15M isn't worth the work.
Angel investors and tiny funds use the same ideas as venture funds, but their smaller scale affects the calculations. If a company can support its growth through exit on less than $2M in angel financing, it must have $25M in revenues before large companies will consider acquiring it.
Aiming for Hypergrowth
A startup's size isn't enough. It must expand fast.
Developing a great business takes time. Complex technology must be constructed and tested, a nationwide expansion must be built, or production procedures must go from lab to pilot to factories. These can be enormous, world-changing corporations, but venture investment is difficult.
The normal 10-year venture fund life. Investments are made during first 3–4 years.. 610 years pass between investment and fund dissolution. Funds need their investments to exit within 5 years, 7 at the most, therefore add a safety margin.
Longer exit times reduce ROI. A 2-fold return in a year is excellent. Loss at 2x in 7 years.
Lastly, VCs must prove success to raise their next capital. The 2nd fund is raised from 1st fund portfolio increases. Third fund is raised using 1st fund's cash return. Fund managers must raise new money quickly to keep their jobs.
Branding or technology that is protected
No big firm will buy a startup at a high price if they can produce a competing product for less. Their development teams, consumer base, and sales and marketing channels are large. Who needs you?
Patents, specialist knowledge, or brand name are the only answers. The acquirer buys this, not the thing.
I've heard of several promising startups. It's not a decent investment if there's no exit strategy.
A company that installs EV charging stations in apartments and shopping areas is an example. It's profitable, repeatable, and big. A terrific company. Not a startup.
This building company's operations aren't secret. No technology to protect, no special information competitors can't figure out, no go-to brand name. Despite the immense possibilities, a large construction company would be better off starting their own.
Most venture businesses build products, not services. Services can be profitable but hard to safeguard.
Probable purchase at high multiple
Once a software business proves its value, acquiring it is easy. Pharma and medtech firms have given up on their own research and instead acquire startups after regulatory permission. Many startups, especially in specialized areas, have this weakness.
That doesn't mean any lucrative $25M-plus business won't be acquired. In many businesses, the venture model requires a high exit premium.
A startup invents a new glue. 3M, BASF, Henkel, and others may buy them. Adding more adhesive to their catalogs won't boost commerce. They won't compete to buy the business. They'll only buy a startup at a profitable price. The acquisition price represents a moderate EBITDA multiple.
The company's $100M revenue presumably yields $10m in profits (assuming they’ve reached profitability at all). A $30M-$50M transaction is likely. Not terrible, but not what venture investors want after investing $25M to create a plant and develop the business.
Private equity buys profitable companies for a moderate profit multiple. It's a good exit for entrepreneurs, but not for investors seeking 10x or more what PE firms pay. If a startup offers private equity as an exit, the conversation is over.
Constructed for purchase
The startup wants a high-multiple exit. Unless the company targets $1B in revenue and does an IPO, exit means acquisition.
If they're constructing the business for acquisition or themselves, founders must decide.
If you want an indefinitely-running business, I applaud you. We need more long-term founders. Most successful organizations are founded around consumer demands, not venture capital's urge to grow fast and exit. Not venture funding.
if you don't match the venture model, what to do
VC funds moonshots. The 10% that succeed are extraordinary. Not every firm is a rocketship, and launching the wrong startup into space, even with money, will explode.
But just because your startup won't make $100M in 5 years doesn't mean it's a bad business. Most successful companies don't follow this model. It's not venture capital-friendly.
Although venture capital gets the most attention due to a few spectacular triumphs (and disasters), it's not the only or even most typical option to fund a firm.
Other ways to support your startup:
Personal and family resources, such as credit cards, second mortgages, and lines of credit
bootstrapping off of sales
government funding and honors
Private equity & project financing
collaborating with a big business
Including a business partner
Before pitching angels and VCs, be sure your startup qualifies. If so, include them in your pitch.

rekt
4 years ago
LCX is the latest CEX to have suffered a private key exploit.
The attack began around 10:30 PM +UTC on January 8th.
Peckshield spotted it first, then an official announcement came shortly after.
We’ve said it before; if established companies holding millions of dollars of users’ funds can’t manage their own hot wallet security, what purpose do they serve?
The Unique Selling Proposition (USP) of centralised finance grows smaller by the day.
The official incident report states that 7.94M USD were stolen in total, and that deposits and withdrawals to the platform have been paused.
LCX hot wallet: 0x4631018f63d5e31680fb53c11c9e1b11f1503e6f
Hacker’s wallet: 0x165402279f2c081c54b00f0e08812f3fd4560a05
Stolen funds:
- 162.68 ETH (502,671 USD)
- 3,437,783.23 USDC (3,437,783 USD)
- 761,236.94 EURe (864,840 USD)
- 101,249.71 SAND Token (485,995 USD)
- 1,847.65 LINK (48,557 USD)
- 17,251,192.30 LCX Token (2,466,558 USD)
- 669.00 QNT (115,609 USD)
- 4,819.74 ENJ (10,890 USD)
- 4.76 MKR (9,885 USD)
**~$1M worth of $LCX remains in the address, along with 611k EURe which has been frozen by Monerium.
The rest, a total of 1891 ETH (~$6M) was sent to Tornado Cash.**
Why can’t they keep private keys private?
Is it really that difficult for a traditional corporate structure to maintain good practice?
CeFi hacks leave us with little to say - we can only go on what the team chooses to tell us.
Next time, they can write this article themselves.
See below for a template.