




More on Lifestyle

Sam Hickmann
4 years ago
The Jordan 6 Rings Reintroduce Classic Bulls
The Jordan 6 Rings return in Bulls colors, a deviation from previous releases. The signature red color is used on the midsole and heel, as well as the chenille patch and pull tab. The rest of the latter fixture is black, matching the outsole and adjacent Jumpman logos. Finally, white completes the look, from the leather mudguard to the lace unit. Here's a closer look at the Jordan 6 Rings. Sizes should be available soon on Nike.com and select retailers. Also, official photos of the Air Jordan 1 Denim have surfaced.
Jordan 6 Rings
Release Date: 2022
Color: N/A
Mens: $130
Style Code: 322992-126

Michael Le
4 years ago
Union LA x Air Jordan 2 “Future Is Now” PREVIEW
With the help of Virgil Abloh and Union LA‘s Chris Gibbs, it's now clear that Jordan Brand intended to bring the Air Jordan 2 back in 2022.
The “Future Is Now” collection includes two colorways of MJ's second signature as well as an extensive range of apparel and accessories.
“We wanted to juxtapose what some futuristic gear might look like after being worn and patina'd,”
Union stated on the collaboration's landing page.
“You often see people's future visions that are crisp and sterile. We thought it would be cool to wear it in and make it organic...”
The classic co-branding appears on short-sleeve tees, hoodies, and sweat shorts/sweat pants, all lightly distressed at the hems and seams.
Also, a filtered black-and-white photo of MJ graces the adjacent long sleeves, labels stitch into the socks, and the Jumpman logo adorns the four caps.
Liner jackets and flight pants will also be available, adding reimagined militaria to a civilian ensemble.
The Union LA x Air Jordan 2 (Grey Fog and Rattan) shares many of the same beats. Vintage suedes show age, while perforations and detailing reimagine Bruce Kilgore's design for the future.
The “UN/LA” tag across the modified eye stays, the leather patch across the tongue, and the label that wraps over the lateral side of the collar complete the look.
The footwear will also include a Crater Slide in the “Grey Fog” color scheme.
BUYING
On 4/9 and 4/10 from 9am-3pm, Union LA will be giving away a pair of Air Jordan 2s at their La Brea storefront (110 S. LA BREA AVE. LA, CA 90036). The raffle is only open to LA County residents with a valid CA ID. You must enter by 11:59pm on 4/10 to win. Winners will be notified via email.

Stephen Rivers
4 years ago
Because of regulations, the $3 million Mercedes-AMG ONE will not (officially) be available in the United States or Canada.
We asked Mercedes to clarify whether "customers" refers to people who have expressed interest in buying the AMG ONE but haven't made a down payment or paid in full for a production slot, and a company spokesperson told that it's the latter – "Actual customers for AMG ONE in the United States and Canada."
The Mercedes-AMG ONE has finally arrived in manufacturing form after numerous delays. This may be the most complicated and magnificent hypercar ever created, but according to Mercedes, those roads will not be found in the United States or Canada.
Despite all of the well-deserved excitement around the gorgeous AMG ONE, there was no word on when US customers could expect their cars. Our Editor-in-Chief became aware of this and contacted Mercedes to clarify the matter. Mercedes-hypercar AMG's with the F1-derived 1,049 HP 1.6-liter V6 engine will not be homologated for the US market, they've confirmed.
Mercedes has informed its customers in the United States and Canada that the ONE will not be arriving to North America after all, as of today, June 1, 2022. The whole text of the letter is included below, so sit back and wait for Mercedes to explain why we (or they) won't be getting (or seeing) the hypercar. Mercedes claims that all 275 cars it wants to produce have already been reserved, with net pricing in Europe starting at €2.75 million (about US$2.93 million at today's exchange rates), before country-specific taxes.
"The AMG-ONE was created with one purpose in mind: to provide a straight technology transfer of the World Championship-winning Mercedes-AMG Petronas Formula 1 E PERFORMANCE drive unit to the road." It's the first time a complete Formula 1 drive unit has been integrated into a road car.
Every component of the AMG ONE has been engineered to redefine high performance, with 1,000+ horsepower, four electric motors, and a blazing top speed of more than 217 mph. While the engine's beginnings are in competition, continuous research and refinement has left us with a difficult choice for the US market.
We determined that following US road requirements would considerably damage its performance and overall driving character in order to preserve the distinctive nature of its F1 powerplant. We've made the strategic choice to make the automobile available for road use in Europe, where it complies with all necessary rules."
If this is the first time US customers have heard about it, which it shouldn't be, we understand if it's a bit off-putting. The AMG ONE could very probably be Mercedes' final internal combustion hypercar of this type.
Nonetheless, we wouldn't be surprised if a few make their way to the United States via the federal government's "Show and Display" exemption provision. This legislation permits the importation of automobiles such as the AMG ONE, but only for a total of 2,500 miles per year.
The McLaren Speedtail, the Koenigsegg One:1, and the Bugatti EB110 are among the automobiles that have been imported under this special rule. We just hope we don't have to wait too long to see the ONE in the United States.
You might also like

Alex Mathers
3 years ago Draft
12 practices of the zenith individuals I know

Calmness is a vital life skill.
It aids communication. It boosts creativity and performance.
I've studied calm people's habits for years. Commonalities:
Have learned to laugh at themselves.
Those who have something to protect can’t help but make it a very serious business, which drains the energy out of the room.
They are fixated on positive pursuits like making cool things, building a strong physique, and having fun with others rather than on depressing influences like the news and gossip.
Every day, spend at least 20 minutes moving, whether it's walking, yoga, or lifting weights.
Discover ways to take pleasure in life's challenges.
Since perspective is malleable, they change their view.
Set your own needs first.
Stressed people neglect themselves and wonder why they struggle.
Prioritize self-care.
Don't ruin your life to please others.
Make something.
Calm people create more than react.
They love creating beautiful things—paintings, children, relationships, and projects.
Hold your breath, please.
If you're stressed or angry, you may be surprised how much time you spend holding your breath and tightening your belly.
Release, breathe, and relax to find calm.
Stopped rushing.
Rushing is disadvantageous.
Calm people handle life better.
Are attuned to their personal dietary needs.
They avoid junk food and eat foods that keep them healthy, happy, and calm.
Don’t take anything personally.
Stressed people control everything.
Self-conscious.
Calm people put others and their work first.
Keep their surroundings neat.
Maintaining an uplifting and clutter-free environment daily calms the mind.
Minimise negative people.
Calm people are ruthless with their boundaries and avoid negative and drama-prone people.

Florian Wahl
3 years ago
An Approach to Product Strategy
I've been pondering product strategy and how to articulate it. Frameworks helped guide our thinking.
If your teams aren't working together or there's no clear path to victory, your product strategy may not be well-articulated or communicated (if you have one).
Before diving into a product strategy's details, it's important to understand its role in the bigger picture — the pieces that move your organization forward.
the overall picture
A product strategy is crucial, in my opinion. It's part of a successful product or business. It's the showpiece.
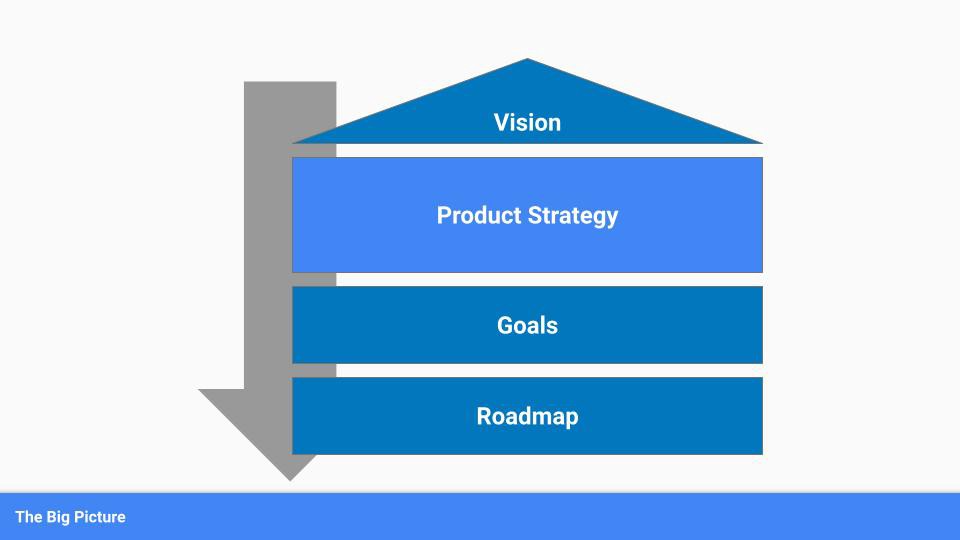
To simplify, we'll discuss four main components:
Vision
Product Management
Goals
Roadmap
Vision
Your company's mission? Your company/product in 35 years? Which headlines?
The vision defines everything your organization will do in the long term. It shows how your company impacted the world. It's your organization's rallying cry.
An ambitious but realistic vision is needed.
Without a clear vision, your product strategy may be inconsistent.
Product Management
Our main subject. Product strategy connects everything. It fulfills the vision.
In Part 2, we'll discuss product strategy.
Goals
This component can be goals, objectives, key results, targets, milestones, or whatever goal-tracking framework works best for your organization.
These product strategy metrics will help your team prioritize strategies and roadmaps.
Your company's goals should be unified. This fuels success.
Roadmap
The roadmap is your product strategy's timeline. It provides a prioritized view of your team's upcoming deliverables.
A roadmap is time-bound and includes measurable goals for your company. Your team's steps and capabilities for executing product strategy.
If your team has trouble prioritizing or defining a roadmap, your product strategy or vision is likely unclear.
Formulation of a Product Strategy
Now that we've discussed where your product strategy fits in the big picture, let's look at a framework.
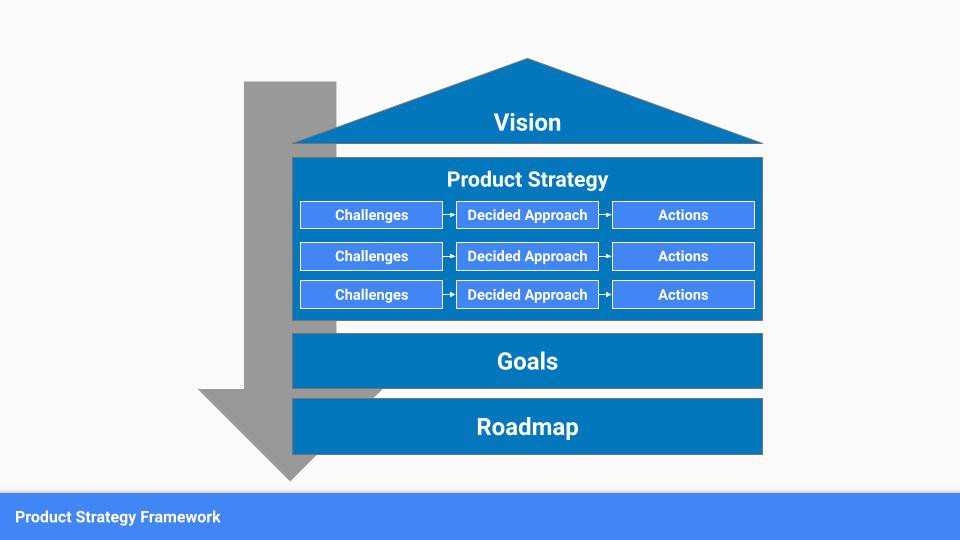
A product strategy should include challenges, an approach, and actions.
Challenges
First, analyze the problems/situations you're solving. It can be customer- or company-focused.
The analysis should explain the problems and why they're important. Try to simplify the situation and identify critical aspects.
Some questions:
What issues are we attempting to resolve?
What obstacles—internal or otherwise—are we attempting to overcome?
What is the opportunity, and why should we pursue it, in your opinion?
Decided Method
Second, describe your approach. This can be a set of company policies for handling the challenge. It's the overall approach to the first part's analysis.
The approach can be your company's bets, the solutions you've found, or how you'll solve the problems you've identified.
Again, these questions can help:
What is the value that we hope to offer to our clients?
Which market are we focusing on first?
What makes us stand out? Our benefit over rivals?
Actions
Third, identify actions that result from your approach. Second-part actions should be these.
Coordinate these actions. You may need to add products or features to your roadmap, acquire new capabilities through partnerships, or launch new marketing campaigns. Whatever fits your challenges and strategy.
Final questions:
What skills do we need to develop or obtain?
What is the chosen remedy? What are the main outputs?
What else ought to be added to our road map?
Put everything together
… and iterate!
Strategy isn't one-and-done. Changes occur. Economies change. Competitors emerge. Customer expectations change.
One unexpected event can make strategies obsolete quickly. Muscle it. Review, evaluate, and course-correct your strategies with your teams. Quarterly works. In a new or unstable industry, more often.

Ray Dalio
4 years ago
The latest “bubble indicator” readings.
As you know, I like to turn my intuition into decision rules (principles) that can be back-tested and automated to create a portfolio of alpha bets. I use one for bubbles. Having seen many bubbles in my 50+ years of investing, I described what makes a bubble and how to identify them in markets—not just stocks.
A bubble market has a high degree of the following:
- High prices compared to traditional values (e.g., by taking the present value of their cash flows for the duration of the asset and comparing it with their interest rates).
- Conditons incompatible with long-term growth (e.g., extrapolating past revenue and earnings growth rates late in the cycle).
- Many new and inexperienced buyers were drawn in by the perceived hot market.
- Broad bullish sentiment.
- Debt financing a large portion of purchases.
- Lots of forward and speculative purchases to profit from price rises (e.g., inventories that are more than needed, contracted forward purchases, etc.).
I use these criteria to assess all markets for bubbles. I have periodically shown you these for stocks and the stock market.
What Was Shown in January Versus Now
I will first describe the picture in words, then show it in charts, and compare it to the last update in January.
As of January, the bubble indicator showed that a) the US equity market was in a moderate bubble, but not an extreme one (ie., 70 percent of way toward the highest bubble, which occurred in the late 1990s and late 1920s), and b) the emerging tech companies (ie. As well, the unprecedented flood of liquidity post-COVID financed other bubbly behavior (e.g. SPACs, IPO boom, big pickup in options activity), making things bubbly. I showed which stocks were in bubbles and created an index of those stocks, which I call “bubble stocks.”
Those bubble stocks have popped. They fell by a third last year, while the S&P 500 remained flat. In light of these and other market developments, it is not necessarily true that now is a good time to buy emerging tech stocks.
The fact that they aren't at a bubble extreme doesn't mean they are safe or that it's a good time to get long. Our metrics still show that US stocks are overvalued. Once popped, bubbles tend to overcorrect to the downside rather than settle at “normal” prices.
The following charts paint the picture. The first shows the US equity market bubble gauge/indicator going back to 1900, currently at the 40% percentile. The charts also zoom in on the gauge in recent years, as well as the late 1920s and late 1990s bubbles (during both of these cases the gauge reached 100 percent ).
The chart below depicts the average bubble gauge for the most bubbly companies in 2020. Those readings are down significantly.
The charts below compare the performance of a basket of emerging tech bubble stocks to the S&P 500. Prices have fallen noticeably, giving up most of their post-COVID gains.
The following charts show the price action of the bubble slice today and in the 1920s and 1990s. These charts show the same market dynamics and two key indicators. These are just two examples of how a lot of debt financing stock ownership coupled with a tightening typically leads to a bubble popping.
Everything driving the bubbles in this market segment is classic—the same drivers that drove the 1920s bubble and the 1990s bubble. For instance, in the last couple months, it was how tightening can act to prick the bubble. Review this case study of the 1920s stock bubble (starting on page 49) from my book Principles for Navigating Big Debt Crises to grasp these dynamics.
The following charts show the components of the US stock market bubble gauge. Since this is a proprietary indicator, I will only show you some of the sub-aggregate readings and some indicators.
Each of these six influences is measured using a number of stats. This is how I approach the stock market. These gauges are combined into aggregate indices by security and then for the market as a whole. The table below shows the current readings of these US equity market indicators. It compares current conditions for US equities to historical conditions. These readings suggest that we’re out of a bubble.
1. How High Are Prices Relatively?
This price gauge for US equities is currently around the 50th percentile.
2. Is price reduction unsustainable?
This measure calculates the earnings growth rate required to outperform bonds. This is calculated by adding up the readings of individual securities. This indicator is currently near the 60th percentile for the overall market, higher than some of our other readings. Profit growth discounted in stocks remains high.
Even more so in the US software sector. Analysts' earnings growth expectations for this sector have slowed, but remain high historically. P/Es have reversed COVID gains but remain high historical.
3. How many new buyers (i.e., non-existing buyers) entered the market?
Expansion of new entrants is often indicative of a bubble. According to historical accounts, this was true in the 1990s equity bubble and the 1929 bubble (though our data for this and other gauges doesn't go back that far). A flood of new retail investors into popular stocks, which by other measures appeared to be in a bubble, pushed this gauge above the 90% mark in 2020. The pace of retail activity in the markets has recently slowed to pre-COVID levels.
4. How Broadly Bullish Is Sentiment?
The more people who have invested, the less resources they have to keep investing, and the more likely they are to sell. Market sentiment is now significantly negative.
5. Are Purchases Being Financed by High Leverage?
Leveraged purchases weaken the buying foundation and expose it to forced selling in a downturn. The leverage gauge, which considers option positions as a form of leverage, is now around the 50% mark.
6. To What Extent Have Buyers Made Exceptionally Extended Forward Purchases?
Looking at future purchases can help assess whether expectations have become overly optimistic. This indicator is particularly useful in commodity and real estate markets, where forward purchases are most obvious. In the equity markets, I look at indicators like capital expenditure, or how much businesses (and governments) invest in infrastructure, factories, etc. It reflects whether businesses are projecting future demand growth. Like other gauges, this one is at the 40th percentile.
What one does with it is a tactical choice. While the reversal has been significant, future earnings discounting remains high historically. In either case, bubbles tend to overcorrect (sell off more than the fundamentals suggest) rather than simply deflate. But I wanted to share these updated readings with you in light of recent market activity.