


More on Entrepreneurship/Creators
Vanessa Karel
3 years ago
10 hard lessons from founding a startup.
Here is the ugly stuff, read this if you have a founder in your life or are trying to become one. Your call.

#1 You'll try to talk yourself to sleep, but it won't always work.
As founders, we're all driven. Good and bad, you're restless. Success requires resistance and discipline. Your startup will be on your mind 24/7, and not everyone will have the patience to listen to your worries, ideas, and coffee runs. You become more self-sufficient than ever before.
#2 No one will understand what you're going through unless they've been a founder.
Some of my closest friends don't understand the work that goes into starting a business, and we can't blame them.
#3 You'll feel alienated.
Your problems aren't common; calling your bestie won't help. You must search hard for the right resources. It alienates you from conversations you no longer relate to. (No 4th of July, no long weekends!)
#4 Since you're your "own boss," people assume you have lots of free time.
Do you agree? I was on a webinar with lots of new entrepreneurs, and one woman said, "I started my own business so I could have more time for myself." This may be true for some lucky people, and you can be flexible with your schedule. If you want your business to succeed, you'll probably be its slave for a while.
#5 No time for illness or family emergencies.
Both last month. Oh, no! Physically and emotionally withdrawing at the worst times will give you perspective. I learned this the hard way because I was too stubborn to postpone an important interview. I thought if I rested all day and only took one call, I'd be fine. Nope. I had a fever and my mind wasn't as sharp, so my performance and audience interaction suffered. Nope. Better to delay than miss out.
Oh, and setting a "OoO" makes you cringe.
#6 Good luck with your mental health, perfectionists.
When building a startup, it's difficult to accept that there won't be enough time to do everything. You can't make them all, not perfectly. You must learn to accept things that are done but not perfect.
#7 As a founder, you'll make mistakes, but you'll want to make them quickly so you can learn.
Hard lessons are learned quicker. You'll need to pivot and try new things often; some won't work, and it's best to discover them sooner rather than later.
#8 Pyramid schemes abound.
I didn't realize how bad it was until I started a company. You must spy and constantly research. As a founder, you'll receive many emails from people claiming to "support" you. Be wary and keep your eyes open. When it's too good to be true. Some "companies" will try to get you to pay for "competitions" to "pitch at events." Don't do it.
#9 Keep your competitor research to a minimum.
Actually, competition is good. It means there's a market for those solutions. However, this can be mentally exhausting too. Learn about their geography and updates, but that's it.
#10 You'll feel guilty taking vacation.
I don't know what to say, but I no longer enjoy watching TV, and that's okay. Pay attention to things that enrich you, bring you joy, and have fun. It boosts creativity.
Being a startup founder may be one of the hardest professional challenges you face, but it's also a great learning experience. Your passion will take you places you never imagined and open doors to opportunities you wouldn't have otherwise. You'll meet amazing people. No regrets, no complaints. It's a roller coaster, but the good days are great.
Miss anything? Comment below

Davlin Knight
3 years ago
2 pitfalls to stay away from when launching a YouTube channel
You do not want to miss these
Stop! Stop it! Two things to avoid when starting a YouTube channel. Critical. Possible channel-killers Its future revenue.
I'll tell you now, so don't say "I wish I knew."
The Notorious Copyright Allegation
My YouTube channel received a copyright claim before I sold it. This claim was on a one-minute video I thought I'd changed enough to make mine, but the original owner disagreed.
It cost me thousands in ad revenue. Original owner got the profits.
Well, it wasn't your video, you say.
Touché.
I've learned. Sorta
I couldn't stop looking at the video's views. The video got 1,000,000 views without any revenue. I made 4 more similar videos.
If they didn't get copyrighted, I'd be rolling in dough.
You've spent a week editing and are uploading to YouTube. You're thrilled as you stand and stretch your back. You see the video just before publishing.
No way!
The red exclamation point on checks.
Copyright claim!
YouTube lets you publish, but you won't make money.
Sounds fair? Well, it is.
Copyright claims mean you stole someone's work. Song, image, or video clip.
We wouldn't want our content used for money.
The only problem with this is that almost everything belongs to someone else. I doubt some of the biggest creators are sitting down and making their music for their videos. That just seems really excessive when you could make a quick search on YouTube and download a song (I definitely don’t do this because that would be stealing).
So how do you defeat a copyright defense?
Even copyright-free songs on YouTube aren't guaranteed. Some copyrighted songs claim to be free.
Use YouTube's free music library or pay for a subscription to adobe stock, epidemic sound, or artlist.io.
Most of my videos have Nintendo music. Almost all game soundtracks are copyright-free and offer a variety of songs.
Restriction on age
Age restrictions are a must-avoid. A channel dies.
YouTube never suggests age-restricted videos.
Shadow banning means YouTube hides your content from subscribers and non-subscribers.
Keeping your channel family-friendly can help.
I hear you complaining that your channel isn't for kids. I agree. Not everyone has a clean mouth or creates content for minors.
YouTube has changed rapidly in recent years. Focusing on kids. Fewer big creators are using profanity or explicit content in videos. Not YouTube-worthy.
Youtube wants to be family-friendly. A family-friendly movie. It won't promote illegal content. Yes, it allows profanity.
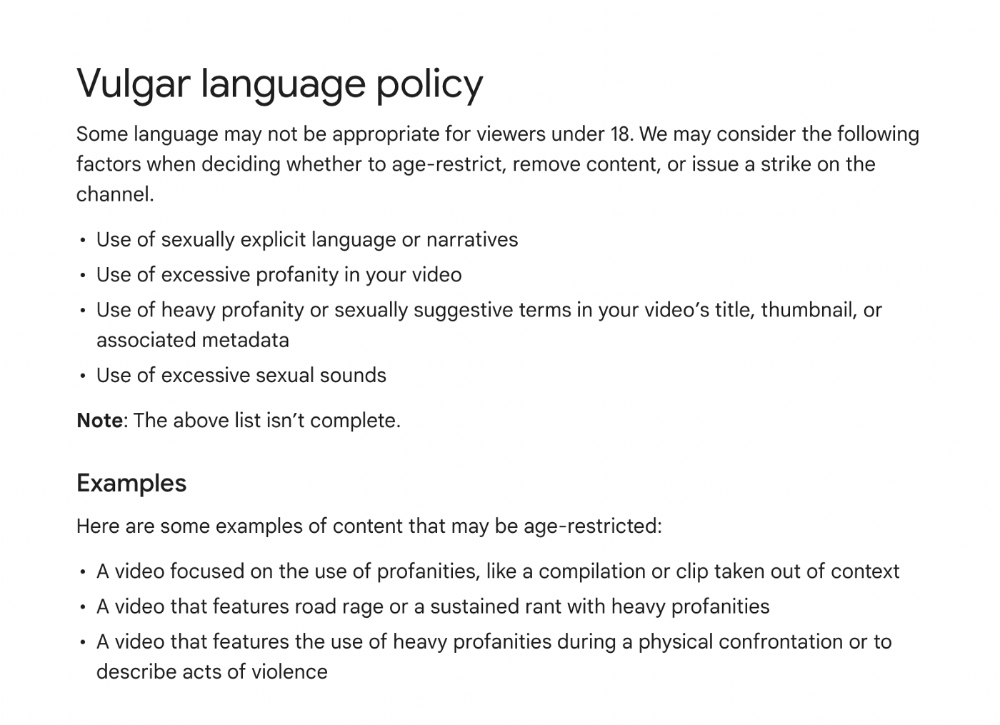
Do I recommend avoiding no-no words in videos? Never. Okay. YouTube's policies are shaky. YouTube uses video content to determine ad suitability.
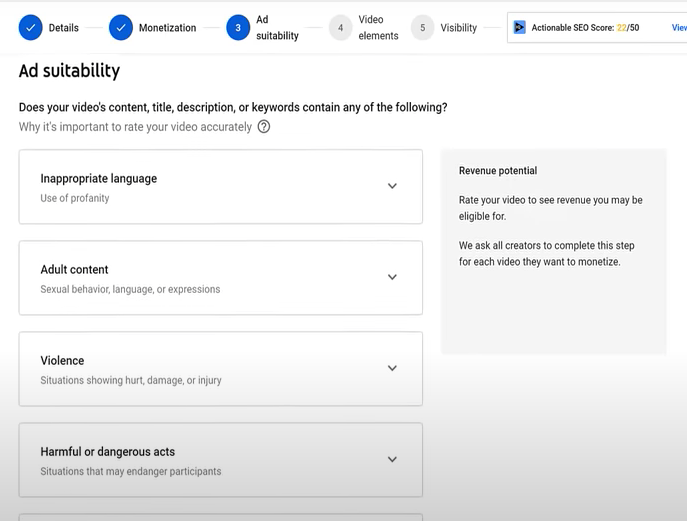
No joke. If you're serious about becoming a content creator, avoid profanity and inappropriate topics.
If your channel covers 18+ topics, like crime or commentary, censor as much as possible.
YouTube can be like walking on eggshells. You never know what is gonna upset the boss. So play it safe and try to avoid getting on their bad side.
Mr. Beast, Dream, Markplier, Faze Rug, and PewDewPie are popular creators. They maintain it family-friendly while entertaining fans.
You got this.

Alex Mathers
25 years ago
400 articles later, nobody bothered to read them.
Writing for readers:
14 years of daily writing.
I post practically everything on social media. I authored hundreds of articles, thousands of tweets, and numerous volumes to almost no one.
Tens of thousands of readers regularly praise me.
I despised writing. I'm stuck now.
I've learned what readers like and what doesn't.
Here are some essential guidelines for writing with impact:
Readers won't understand your work if you can't.
Though obvious, this slipped me up. Share your truths.
Stories engage human brains.
Showing the journey of a person from worm to butterfly inspires the human spirit.
Overthinking hinders powerful writing.
The best ideas come from inner understanding in between thoughts.
Avoid writing to find it. Write.
Writing a masterpiece isn't motivating.
Write for five minutes to simplify. Step-by-step, entertaining, easy steps.
Good writing requires a willingness to make mistakes.
So write loads of garbage that you can edit into a good piece.
Courageous writing.
A courageous story will move readers. Personal experience is best.
Go where few dare.
Templates, outlines, and boundaries help.
Limitations enhance writing.
Excellent writing is straightforward and readable, removing all the unnecessary fat.
Use five words instead of nine.
Use ordinary words instead of uncommon ones.
Readers desire relatability.
Too much perfection will turn it off.
Write to solve an issue if you can't think of anything to write.
Instead, read to inspire. Best authors read.
Every tweet, thread, and novel must have a central idea.
What's its point?
This can make writing confusing.
️ Don't direct your reader.
Readers quit reading. Demonstrate, describe, and relate.
Even if no one responds, have fun. If you hate writing it, the reader will too.
You might also like

Enrique Dans
3 years ago
When we want to return anything, why on earth do stores still require a receipt?
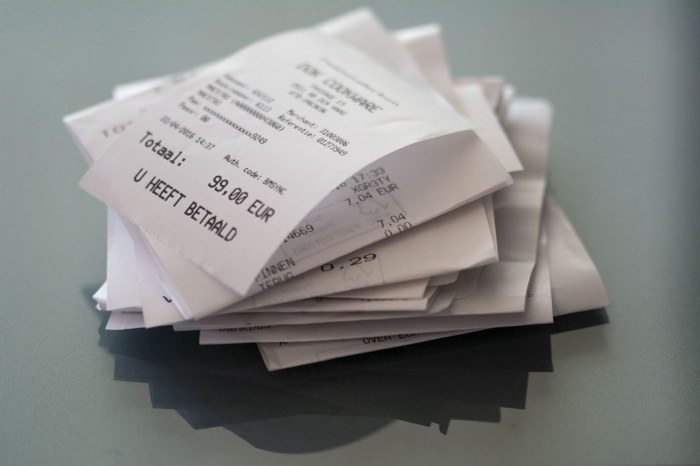
A friend told me of an incident she found particularly irritating: a retailer where she is a frequent client, with an account and loyalty card, asked for the item's receipt.
We all know that stores collect every bit of data they can on us, including our socio-demographic profile, address, shopping habits, and everything we've ever bought, so why would they need a fading receipt? Who knows? That their consumers try to pass off other goods? It's easy to verify past transactions to see when the item was purchased.
That's it. Why require receipts? Companies send us incentives, discounts, and other marketing, yet when we need something, we have to prove we're not cheating.
Why require us to preserve data and documents when our governments and governmental institutions already have them? Why do I need to carry documents like my driver's license if the authorities can check if I have one and what state it's in once I prove my identity?
We shouldn't be required to give someone data or documents they already have. The days of waiting up with our paperwork for a stern official to inform us something is missing are over.
How can retailers still ask if you have a receipt if we've made our slow, bureaucratic, and all-powerful government sensible? Then what? The shop may not accept your return (which has a two-year window, longer than most purchase tickets last) or they may just let you replace the item.
Isn't this an anachronism in the age of CRMs, customer files that know what we ate for breakfast, and loyalty programs? If government and bureaucracies have learnt to use its own files and make life easier for the consumer, why do retailers ask for a receipt?
They're adding friction to the system. They know we can obtain a refund, use our warranty, or get our money back. But if I ask for ludicrous criteria, like keeping the purchase receipt in your wallet (wallet? another anachronism, if I leave the house with only my smartphone! ), it will dissuade some individuals and tip the scales in their favor when it comes to limiting returns. Some manager will take credit for lowering returns and collect her annual bonus. Having the wrong metrics is common in management.
To slow things down, asking for a receipt is like asking us to perform a handstand and leap 20 times on one foot. You have my information, use it to send me everything, and know everything I've bought, yet when I need a two-way service, you refuse to utilize it and require that I keep it and prove it.
Refuse as customers. If retailers want our business, they should treat us well, not just when we spend money. If I come to return a product, claim its use or warranty, or be taught how to use it, I am the same person you treated wonderfully when I bought it. Remember that, and act accordingly.
A store should use my information for everything, not just what it wants. Keep my info, but don't sell me anything.

William Brucee
3 years ago
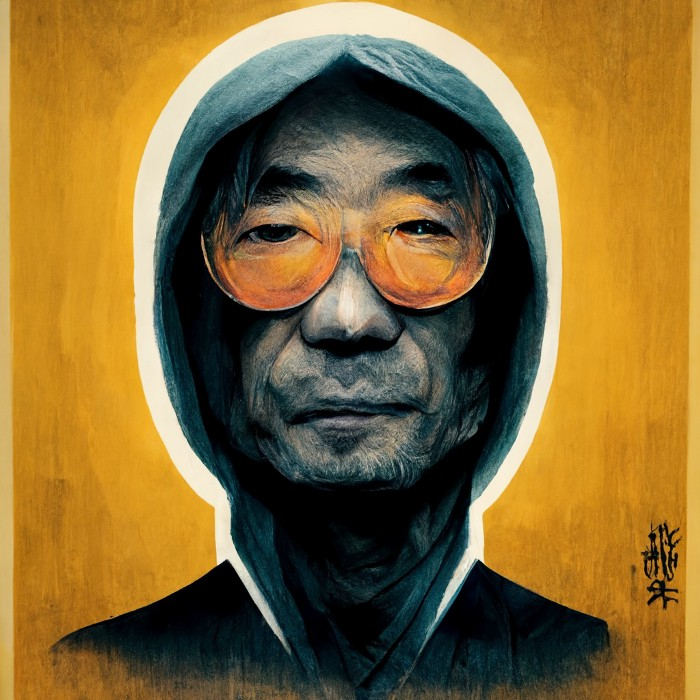
This person is probably Satoshi Nakamoto.
Who founded bitcoin is the biggest mystery in technology today, not how it works.
On October 31, 2008, Satoshi Nakamoto posted a whitepaper to a cryptography email list. Still confused by the mastermind who changed monetary history.
Journalists and bloggers have tried in vain to uncover bitcoin's creator. Some candidates self-nominated. We're still looking for the mystery's perpetrator because none of them have provided proof.
One person. I'm confident he invented bitcoin. Let's assess Satoshi Nakamoto before I reveal my pick. Or what he wants us to know.
Satoshi's P2P Foundation biography says he was born in 1975. He doesn't sound or look Japanese. First, he wrote the whitepaper and subsequent articles in flawless English. His sleeping habits are unusual for a Japanese person.
Stefan Thomas, a Bitcoin Forum member, displayed Satoshi's posting timestamps. Satoshi Nakamoto didn't publish between 2 and 8 p.m., Japanese time. Satoshi's identity may not be real.
Why would he disguise himself?
There is a legitimate explanation for this
Phil Zimmermann created PGP to give dissidents an open channel of communication, like Pretty Good Privacy. US government seized this technology after realizing its potential. Police investigate PGP and Zimmermann.
This technology let only two people speak privately. Bitcoin technology makes it possible to send money for free without a bank or other intermediary, removing it from government control.
How much do we know about the person who invented bitcoin?
Here's what we know about Satoshi Nakamoto now that I've covered my doubts about his personality.
Satoshi Nakamoto first appeared with a whitepaper on metzdowd.com. On Halloween 2008, he presented a nine-page paper on a new peer-to-peer electronic monetary system.
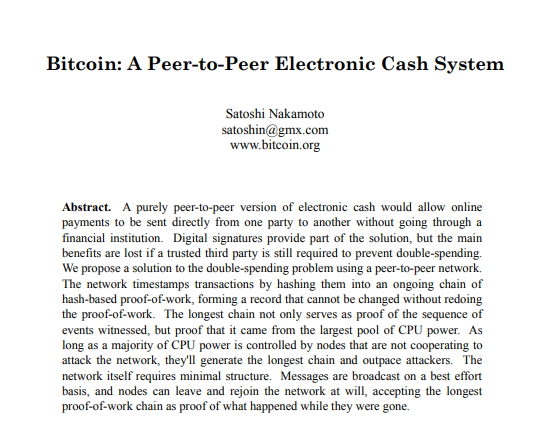
Using the nickname satoshi, he created the bitcointalk forum. He kept developing bitcoin and created bitcoin.org. Satoshi mined the genesis block on January 3, 2009.
Satoshi Nakamoto worked with programmers in 2010 to change bitcoin's protocol. He engaged with the bitcoin community. Then he gave Gavin Andresen the keys and codes and transferred community domains. By 2010, he'd abandoned the project.
The bitcoin creator posted his goodbye on April 23, 2011. Mike Hearn asked Satoshi if he planned to rejoin the group.
“I’ve moved on to other things. It’s in good hands with Gavin and everyone.”
Nakamoto Satoshi
The man who broke the banking system vanished. Why?
Satoshi's wallets held 1,000,000 BTC. In December 2017, when the price peaked, he had over US$19 billion. Nakamoto had the 44th-highest net worth then. He's never cashed a bitcoin.
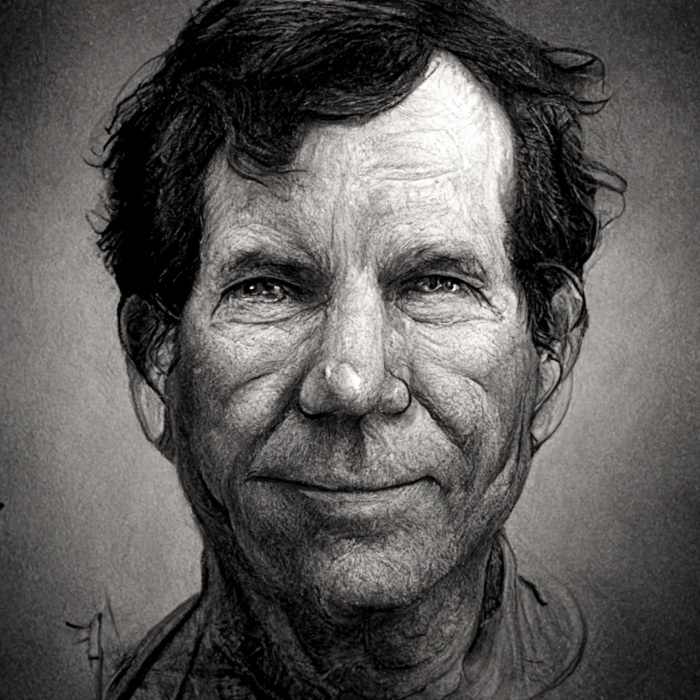
This data suggests something happened to bitcoin's creator. I think Hal Finney is Satoshi Nakamoto .
Hal Finney had ALS and died in 2014. I suppose he created the future of money, then he died, leaving us with only rumors about his identity.
Hal Finney, who was he?
Hal Finney graduated from Caltech in 1979. Student peers voted him the smartest. He took a doctoral-level gravitational field theory course as a freshman. Finney's intelligence meets the first requirement for becoming Satoshi Nakamoto.
Students remember Finney holding an Ayn Rand book. If he'd read this, he may have developed libertarian views.
His beliefs led him to a small group of freethinking programmers. In the 1990s, he joined Cypherpunks. This action promoted the use of strong cryptography and privacy-enhancing technologies for social and political change. Finney helped them achieve a crypto-anarchist perspective as self-proclaimed privacy defenders.
Zimmermann knew Finney well.
Hal replied to a Cypherpunk message about Phil Zimmermann and PGP. He contacted Phil and became PGP Corporation's first member, retiring in 2011. Satoshi Nakamoto quit bitcoin in 2011.
Finney improved the new PGP protocol, but he had to do so secretly. He knew about Phil's PGP issues. I understand why he wanted to hide his identity while creating bitcoin.
Why did he pretend to be from Japan?
His envisioned persona was spot-on. He resided near scientist Dorian Prentice Satoshi Nakamoto. Finney could've assumed Nakamoto's identity to hide his. Temple City has 36,000 people, so what are the chances they both lived there? A cryptographic genius with the same name as Bitcoin's creator: coincidence?
Things went differently, I think.
I think Hal Finney sent himself Satoshis messages. I know it's odd. If you want to conceal your involvement, do as follows. He faked messages and transferred the first bitcoins to himself to test the transaction mechanism, so he never returned their money.
Hal Finney created the first reusable proof-of-work system. The bitcoin protocol. In the 1990s, Finney was intrigued by digital money. He invented CRypto cASH in 1993.
Legacy
Hal Finney's contributions should not be forgotten. Even if I'm wrong and he's not Satoshi Nakamoto, we shouldn't forget his bitcoin contribution. He helped us achieve a better future.
Jumanne Rajabu Mtambalike
3 years ago
10 Years of Trying to Manage Time and Improve My Productivity.
I've spent the last 10 years of my career mastering time management. I've tried different approaches and followed multiple people and sources. My knowledge is summarized.
Great people, including entrepreneurs, master time management. I learned time management in college. I was studying Computer Science and Finance and leading Tanzanian students in Bangalore, India. I had 24 hours per day to do this and enjoy campus. I graduated and received several awards. I've learned to maximize my time. These tips and tools help me finish quickly.
Eisenhower-Box
I don't remember when I read the article. James Clear, one of my favorite bloggers, introduced me to the Eisenhower Box, which I've used for years. Eliminate waste to master time management. By grouping your activities by importance and urgency, the tool helps you prioritize what matters and drop what doesn't. If it's urgent, do it. Delegate if it's urgent but not necessary. If it's important but not urgent, reschedule it; otherwise, drop it. I integrated the tool with Trello to manage my daily tasks. Since 2007, I've done this.
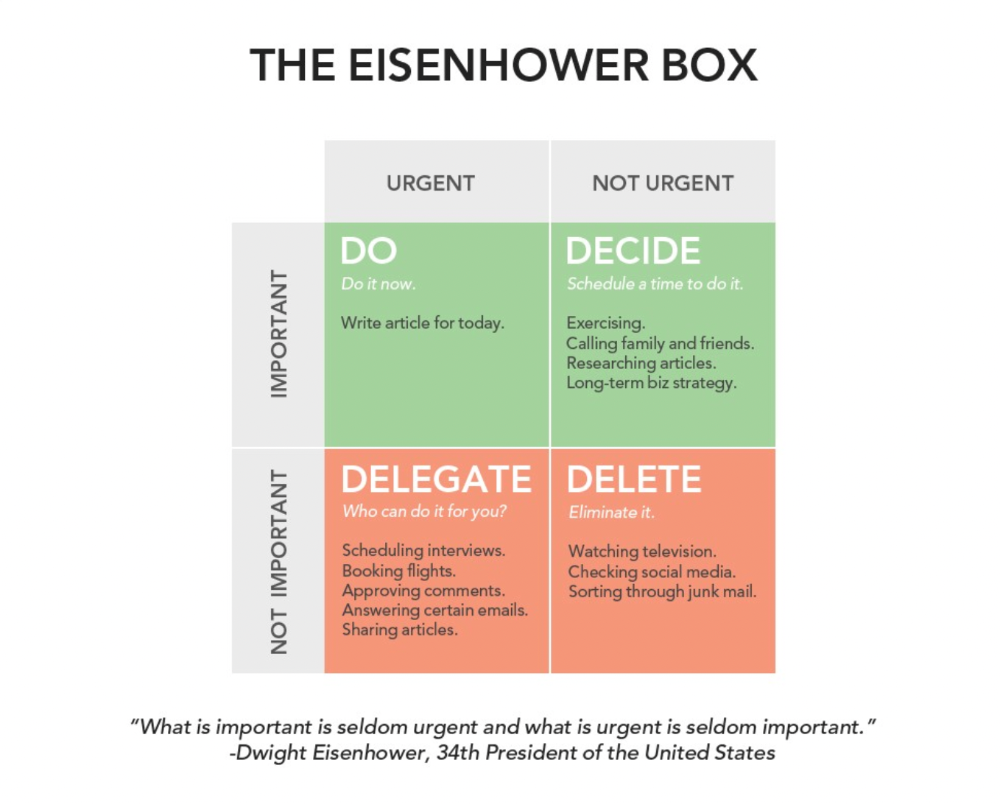
James Clear's article mentions Eisenhower Box.
Essentialism rules
Greg McKeown's book Essentialism introduced me to disciplined pursuit of less. I once wrote about this. I wasn't sure what my career's real opportunities and distractions were. A non-essentialist thinks everything is essential; you want to be everything to everyone, and your life lacks satisfaction. Poor time management starts it all. Reading and applying this book will change your life.
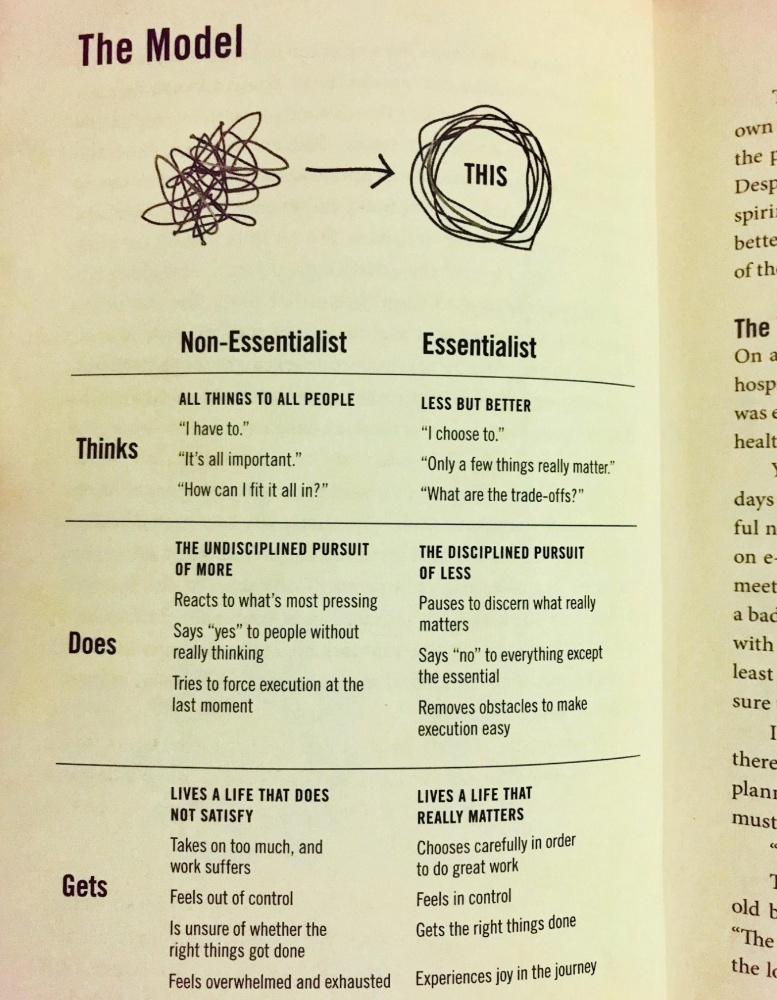
Essential vs non-essential
Life Calendar
Most of us make corporate calendars. Peter Njonjo, founder of Twiga Foods, said he manages time by putting life activities in his core calendars. It includes family retreats, weddings, and other events. He joked that his wife always complained to him to avoid becoming a calendar item. It's key. "Time Masters" manages life's four burners, not just work and corporate life. There's no "work-life balance"; it's life.
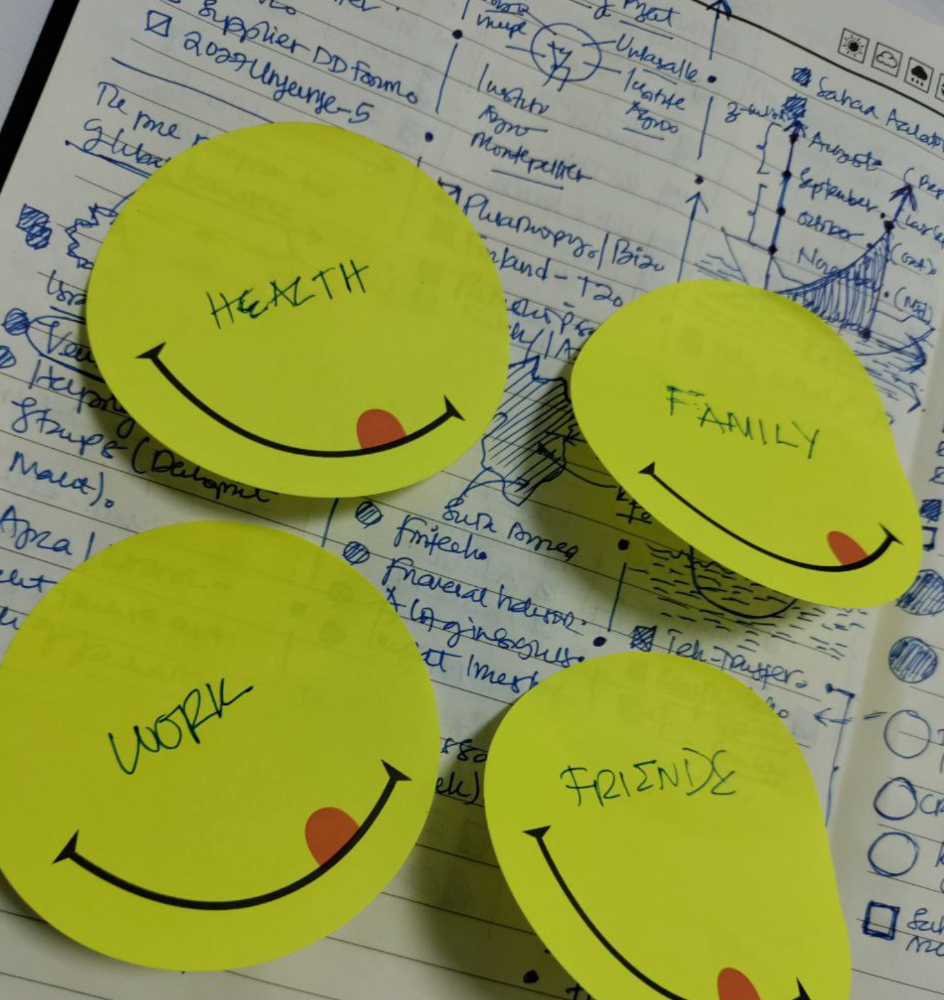
Health, Family, Work, and Friends.
The Brutal No
In a culture where people want to look good, saying "NO" to a favor request seems rude. In reality, the crime is breaking a promise. "Time Masters" have mastered "NO". More "YES" means less time, and more "NO" means more time for tasks and priorities. Brutal No doesn't mean being mean to your coworkers; it means explaining kindly and professionally that you have other priorities.
To-Do vs. MITs
Most people are productive with a routine to-do list. You can't be effective by just checking boxes on a To-do list. When was the last time you completed all of your daily tasks? Never. You must replace the to-do list with Most Important Tasks (MITs). MITs allow you to focus on the most important tasks on your list. You feel progress and accomplishment when you finish these tasks. MITs don't include ad-hoc emails, meetings, etc.
Journal Mapped
Most people don't journal or plan their day in the developing South. I've learned to plan my day in my journal over time. I have multiple sections on one page: MITs (things I want to accomplish that day), Other Activities (stuff I can postpone), Life (health, faith, and family issues), and Pop-Ups (things that just pop up). I leave the next page blank for notes. I reflected on the blocks to identify areas to improve the next day. You will have bad days, but at least you'll realize it was due to poor time management.
Buy time/delegate
Time or money? When you make enough money, you lose time to make more. The smart buy "Time." I resisted buying other people's time for years. I regret not hiring an assistant sooner. Learn to buy time from others and pay for time-consuming tasks. Sometimes you think you're saving money by doing things yourself, but you're actually losing money.
This post is a summary. See the full post here.