


More on Web3 & Crypto

Ashraful Islam
4 years ago
Clean API Call With React Hooks
| Photo by Juanjo Jaramillo on Unsplash |
Calling APIs is the most common thing to do in any modern web application. When it comes to talking with an API then most of the time we need to do a lot of repetitive things like getting data from an API call, handling the success or error case, and so on.
When calling tens of hundreds of API calls we always have to do those tedious tasks. We can handle those things efficiently by putting a higher level of abstraction over those barebone API calls, whereas in some small applications, sometimes we don’t even care.
The problem comes when we start adding new features on top of the existing features without handling the API calls in an efficient and reusable manner. In that case for all of those API calls related repetitions, we end up with a lot of repetitive code across the whole application.
In React, we have different approaches for calling an API. Nowadays mostly we use React hooks. With React hooks, it’s possible to handle API calls in a very clean and consistent way throughout the application in spite of whatever the application size is. So let’s see how we can make a clean and reusable API calling layer using React hooks for a simple web application.
I’m using a code sandbox for this blog which you can get here.
import "./styles.css";
import React, { useEffect, useState } from "react";
import axios from "axios";
export default function App() {
const [posts, setPosts] = useState(null);
const [error, setError] = useState("");
const [loading, setLoading] = useState(false);
useEffect(() => {
handlePosts();
}, []);
const handlePosts = async () => {
setLoading(true);
try {
const result = await axios.get(
"https://jsonplaceholder.typicode.com/posts"
);
setPosts(result.data);
} catch (err) {
setError(err.message || "Unexpected Error!");
} finally {
setLoading(false);
}
};
return (
<div className="App">
<div>
<h1>Posts</h1>
{loading && <p>Posts are loading!</p>}
{error && <p>{error}</p>}
<ul>
{posts?.map((post) => (
<li key={post.id}>{post.title}</li>
))}
</ul>
</div>
</div>
);
}
I know the example above isn’t the best code but at least it’s working and it’s valid code. I will try to improve that later. For now, we can just focus on the bare minimum things for calling an API.
Here, you can try to get posts data from JsonPlaceholer. Those are the most common steps we follow for calling an API like requesting data, handling loading, success, and error cases.
If we try to call another API from the same component then how that would gonna look? Let’s see.
500: Internal Server Error
Now it’s going insane! For calling two simple APIs we’ve done a lot of duplication. On a top-level view, the component is doing nothing but just making two GET requests and handling the success and error cases. For each request, it’s maintaining three states which will periodically increase later if we’ve more calls.
Let’s refactor to make the code more reusable with fewer repetitions.
Step 1: Create a Hook for the Redundant API Request Codes
Most of the repetitions we have done so far are about requesting data, handing the async things, handling errors, success, and loading states. How about encapsulating those things inside a hook?
The only unique things we are doing inside handleComments and handlePosts are calling different endpoints. The rest of the things are pretty much the same. So we can create a hook that will handle the redundant works for us and from outside we’ll let it know which API to call.
500: Internal Server Error
Here, this request function is identical to what we were doing on the handlePosts and handleComments. The only difference is, it’s calling an async function apiFunc which we will provide as a parameter with this hook. This apiFunc is the only independent thing among any of the API calls we need.
With hooks in action, let’s change our old codes in App component, like this:
500: Internal Server Error
How about the current code? Isn’t it beautiful without any repetitions and duplicate API call handling things?
Let’s continue our journey from the current code. We can make App component more elegant. Now it knows a lot of details about the underlying library for the API call. It shouldn’t know that. So, here’s the next step…
Step 2: One Component Should Take Just One Responsibility
Our App component knows too much about the API calling mechanism. Its responsibility should just request the data. How the data will be requested under the hood, it shouldn’t care about that.
We will extract the API client-related codes from the App component. Also, we will group all the API request-related codes based on the API resource. Now, this is our API client:
import axios from "axios";

const apiClient = axios.create({
  // Later read this URL from an environment variable
  baseURL: "https://jsonplaceholder.typicode.com"
});

export default apiClient;
All API calls for comments resource will be in the following file:
import client from "./client";

const getComments = () => client.get("/comments");

export default {
  getComments
};
All API calls for posts resource are placed in the following file:
import client from "./client";

const getPosts = () => client.get("/posts");

export default {
  getPosts
};
Finally, the App component looks like the following:
import "./styles.css";
import React, { useEffect } from "react";
import commentsApi from "./api/comments";
import postsApi from "./api/posts";
import useApi from "./hooks/useApi";

export default function App() {
  const getPostsApi = useApi(postsApi.getPosts);
  const getCommentsApi = useApi(commentsApi.getComments);

  useEffect(() => {
    getPostsApi.request();
    getCommentsApi.request();
  }, []);

  return (
    <div className="App">
      {/* Post List */}
      <div>
        <h1>Posts</h1>
        {getPostsApi.loading && <p>Posts are loading!</p>}
        {getPostsApi.error && <p>{getPostsApi.error}</p>}
        <ul>
          {getPostsApi.data?.map((post) => (
            <li key={post.id}>{post.title}</li>
          ))}
        </ul>
      </div>
      {/* Comment List */}
      <div>
        <h1>Comments</h1>
        {getCommentsApi.loading && <p>Comments are loading!</p>}
        {getCommentsApi.error && <p>{getCommentsApi.error}</p>}
        <ul>
          {getCommentsApi.data?.map((comment) => (
            <li key={comment.id}>{comment.name}</li>
          ))}
        </ul>
      </div>
    </div>
  );
}
Now it doesn’t know anything about how the APIs get called. Tomorrow if we want to change the API calling library from axios to fetch or anything else, our App component code will not get affected. We can just change the codes form client.js This is the beauty of abstraction.
Apart from the abstraction of API calls, Appcomponent isn’t right the place to show the list of the posts and comments. It’s a high-level component. It shouldn’t handle such low-level data interpolation things.
So we should move this data display-related things to another low-level component. Here I placed those directly in the App component just for the demonstration purpose and not to distract with component composition-related things.
Final Thoughts
The React library gives the flexibility for using any kind of third-party library based on the application’s needs. As it doesn’t have any predefined architecture so different teams/developers adopted different approaches to developing applications with React. There’s nothing good or bad. We choose the development practice based on our needs/choices. One thing that is there beyond any choices is writing clean and maintainable codes.

Robert Kim
4 years ago
Crypto Legislation Might Progress Beyond Talk in 2022
Financial regulators have for years attempted to apply existing laws to the multitude of issues created by digital assets. In 2021, leading federal regulators and members of Congress have begun to call for legislation to address these issues. As a result, 2022 may be the year when federal legislation finally addresses digital asset issues that have been growing since the mining of the first Bitcoin block in 2009.
Digital Asset Regulation in the Absence of Legislation
So far, Congress has left the task of addressing issues created by digital assets to regulatory agencies. Although a Congressional Blockchain Caucus formed in 2016, House and Senate members introduced few bills addressing digital assets until 2018. As of October 2021, Congress has not amended federal laws on financial regulation, which were last significantly revised by the Dodd-Frank Act in 2010, to address digital asset issues.
In the absence of legislation, issues that do not fit well into existing statutes have created problems. An example is the legal status of digital assets, which can be considered to be either securities or commodities, and can even shift from one to the other over time. Years after the SEC’s 2017 report applying the definition of a security to digital tokens, the SEC and the CFTC have yet to clarify the distinction between securities and commodities for the thousands of digital assets in existence.
SEC Chair Gary Gensler has called for Congress to act, stating in August, “We need additional Congressional authorities to prevent transactions, products, and platforms from falling between regulatory cracks.” Gensler has reached out to Sen. Elizabeth Warren (D-Ma.), who has expressed her own concerns about the need for legislation.
Legislation on Digital Assets in 2021
While regulators and members of Congress talked about the need for legislation, and the debate over cryptocurrency tax reporting in the 2021 infrastructure bill generated headlines, House and Senate bills proposing specific solutions to various issues quietly started to emerge.
Digital Token Sales
Several House bills attempt to address securities law barriers to digital token sales—some of them by building on ideas proposed by regulators in past years.
Exclusion from the definition of a security. Congressional Blockchain Caucus members have been introducing bills to exclude digital tokens from the definition of a security since 2018, and they have revived those bills in 2021. They include the Token Taxonomy Act of 2021 (H.R. 1628), successor to identically named bills in 2018 and 2019, and the Securities Clarity Act (H.R. 4451), successor to a 2020 namesake.
Safe harbor. SEC Commissioner Hester Peirce proposed a regulatory safe harbor for token sales in 2020, and two 2021 bills have proposed statutory safe harbors. Rep. Patrick McHenry (R-N.C.), Republican leader of the House Financial Services Committee, introduced a Clarity for Digital Tokens Act of 2021 (H.R. 5496) that would amend the Securities Act to create a safe harbor providing a grace period of exemption from Securities Act registration requirements. The Digital Asset Market Structure and Investor Protection Act (H.R. 4741) from Rep. Don Beyer (D-Va.) would amend the Securities Exchange Act to define a new type of security—a “digital asset security”—and add issuers of digital asset securities to an existing provision for delayed registration of securities.
Stablecoins
Stablecoins—digital currencies linked to the value of the U.S. dollar or other fiat currencies—have not yet been the subject of regulatory action, although Treasury Secretary Janet Yellen and Federal Reserve Chair Jerome Powell have each underscored the need to create a regulatory framework for them. The Beyer bill proposes to create a regulatory regime for stablecoins by amending Title 31 of the U.S. Code. Treasury Department approval would be required for any “digital asset fiat-based stablecoin” to be issued or used, under an application process to be established by Treasury in consultation with the Federal Reserve, the SEC, and the CFTC.
Serious consideration for any of these proposals in the current session of Congress may be unlikely. A spate of autumn bills on crypto ransom payments (S. 2666, S. 2923, S. 2926, H.R. 5501) shows that Congress is more inclined to pay attention first to issues that are more spectacular and less arcane. Moreover, the arcaneness of digital asset regulatory issues is likely only to increase further, now that major industry players such as Coinbase and Andreessen Horowitz are starting to roll out their own regulatory proposals.
Digital Dollar vs. Digital Yuan
Impetus to pass legislation on another type of digital asset, a central bank digital currency (CBDC), may come from a different source: rivalry with China.
China established itself as a world leader in developing a CBDC with a pilot project launched in 2020, and in 2021, the People’s Bank of China announced that its CBDC will be used at the Beijing Winter Olympics in February 2022. Republican Senators responded by calling for the U.S. Olympic Committee to forbid use of China’s CBDC by U.S. athletes in Beijing and introducing a bill (S. 2543) to require a study of its national security implications.
The Beijing Olympics could motivate a legislative mandate to accelerate implementation of a U.S. digital dollar, which the Federal Reserve has been in the process of considering in 2021. Antecedents to such legislation already exist. A House bill sponsored by 46 Republicans (H.R. 4792) has a provision that would require the Treasury Department to assess China’s CBDC project and report on the status of Federal Reserve work on a CBDC, and the Beyer bill includes a provision amending the Federal Reserve Act to authorize issuing a digital dollar.
Both parties are likely to support creating a digital dollar. The Covid-19 pandemic made a digital dollar for delivery of relief payments a popular idea in 2020, and House Democrats introduced bills with provisions for creating one in 2020 and 2021. Bipartisan support for a bill on a digital dollar, based on concerns both foreign and domestic in nature, could result.
International rivalry and bipartisan support may make the digital dollar a gateway issue for digital asset legislation in 2022. Legislative work on a digital dollar may open the door for considering further digital asset issues—including the regulatory issues that have been emerging for years—in 2022 and beyond.

Nabil Alouani
3 years ago
Why Cryptocurrency Is Not Dead Despite the FTX Scam
A fraud, free-market, antifragility tale

Crypto's only rival is public opinion.
In less than a week, mainstream media, bloggers, and TikTokers turned on FTX's founder.
While some were surprised, almost everyone with a keyboard and a Twitter account predicted the FTX collapse. These financial oracles should have warned the 1.2 million people Sam Bankman-Fried duped.
After happening, unexpected events seem obvious to our brains. It's a bug and a feature because it helps us cope with disasters and makes our reasoning suck.
Nobody predicted the FTX debacle. Bloomberg? Politicians. Non-famous. No cryptologists. Who?
When FTX imploded, taking billions of dollars with it, an outrage bomb went off, and the resulting shockwave threatens the crypto market's existence.
As someone who lost more than $78,000 in a crypto scam in 2020, I can only understand people’s reactions. When the dust settles and rationality returns, we'll realize this is a natural occurrence in every free market.
What specifically occurred with FTX? (Skip if you are aware.)
FTX is a cryptocurrency exchange where customers can trade with cash. It reached #3 in less than two years as the fastest-growing platform of its kind.
FTX's performance helped make SBF the crypto poster boy. Other reasons include his altruistic public image, his support for the Democrats, and his company Alameda Research.
Alameda Research made a fortune arbitraging Bitcoin.
Arbitrage trading uses small price differences between two markets to make money. Bitcoin costs $20k in Japan and $21k in the US. Alameda Research did that for months, making $1 million per day.
Later, as its capital grew, Alameda expanded its trading activities and began investing in other companies.
Let's now discuss FTX.
SBF's diabolic master plan began when he used FTX-created FTT coins to inflate his trading company's balance sheets. He used inflated Alameda numbers to secure bank loans.
SBF used money he printed himself as collateral to borrow billions for capital. Coindesk exposed him in a report.
One of FTX's early investors tweeted that he planned to sell his FTT coins over the next few months. This would be a minor event if the investor wasn't Binance CEO Changpeng Zhao (CZ).
The crypto space saw a red WARNING sign when CZ cut ties with FTX. Everyone with an FTX account and a brain withdrew money. Two events followed. FTT fell from $20 to $4 in less than 72 hours, and FTX couldn't meet withdrawal requests, spreading panic.
SBF reassured FTX users on Twitter. Good assets.
He lied.
SBF falsely claimed FTX had a liquidity crunch. At the time of his initial claims, FTX owed about $8 billion to its customers. Liquidity shortages are usually minor. To get cash, sell assets. In the case of FTX, the main asset was printed FTT coins.
Sam wouldn't get out of trouble even if he slashed the discount (from $20 to $4) and sold every FTT. He'd flood the crypto market with his homemade coins, causing the price to crash.
SBF was trapped. He approached Binance about a buyout, which seemed good until Binance looked at FTX's books.
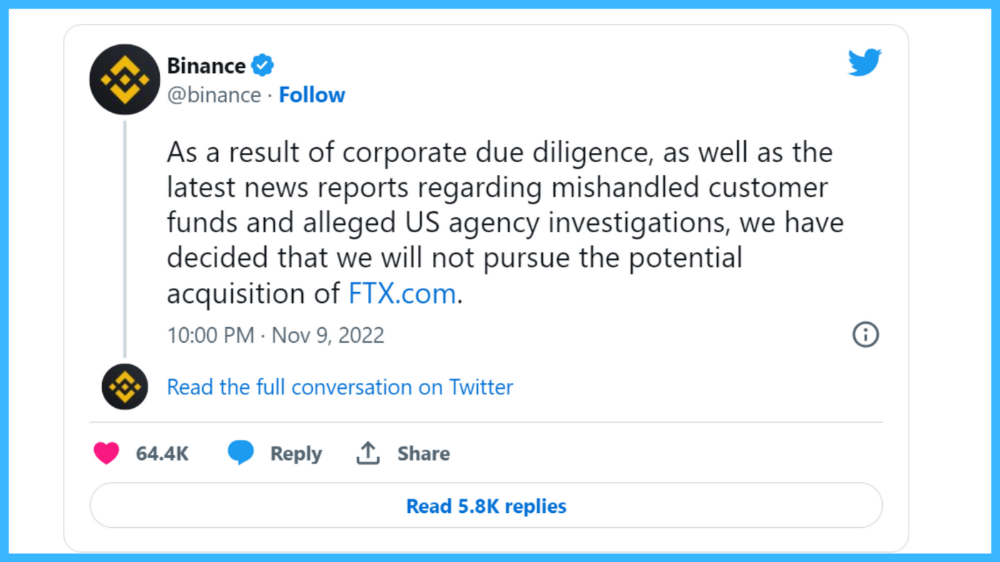
Binance's tweet ended SBF, and he had to apologize, resign as CEO, and file for bankruptcy.
Bloomberg estimated Sam's net worth to be zero by the end of that week. 0!
But that's not all. Twitter investigations exposed fraud at FTX and Alameda Research. SBF used customer funds to trade and invest in other companies.
Thanks to the Twitter indie reporters who made the mainstream press look amateurish. Some Twitter detectives didn't sleep for 30 hours to find answers. Others added to existing threads. Memes were hilarious.
One question kept repeating in my bald head as I watched the Blue Bird. Sam, WTF?
Then I understood.
SBF wanted that FTX becomes a bank.
Think about this. FTX seems healthy a few weeks ago. You buy 2 bitcoins using FTX. You'd expect the platform to take your dollars and debit your wallet, right?
No. They give I-Owe-Yous.
FTX records owing you 2 bitcoins in its internal ledger but doesn't credit your account. Given SBF's tricks, I'd bet on nothing.
What happens if they don't credit my account with 2 bitcoins? Your money goes into FTX's capital, where SBF and his friends invest in marketing, political endorsements, and buying other companies.
Over its two-year existence, FTX invested in 130 companies. Once they make a profit on their purchases, they'll pay you and keep the rest.
One detail makes their strategy dumb. If all FTX customers withdraw at once, everything collapses.
Financially savvy people think FTX's collapse resembles a bank run, and they're right. SBF designed FTX to operate like a bank.
You expect your bank to open a drawer with your name and put $1,000 in it when you deposit $1,000. They deposit $100 in your drawer and create an I-Owe-You for $900. What happens to $900?
Let's sum it up: It's boring and headache-inducing.
When you deposit money in a bank, they can keep 10% and lend the rest. Fractional Reserve Banking is a popular method. Fractional reserves operate within and across banks.
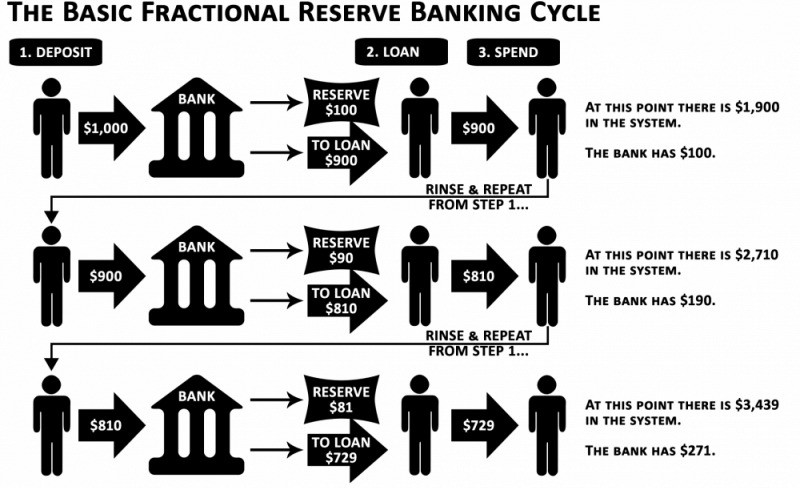
Fractional reserve banking generates $10,000 for every $1,000 deposited. People will pay off their debt plus interest.
As long as banks work together and the economy grows, their model works well.
SBF tried to replicate the system but forgot two details. First, traditional banks need verifiable collateral like real estate, jewelry, art, stocks, and bonds, not digital coupons. Traditional banks developed a liquidity buffer. The Federal Reserve (or Central Bank) injects massive cash into troubled banks.
Massive cash injections come from taxpayers. You and I pay for bankers' mistakes and annual bonuses. Yes, you may think banking is rigged. It's rigged, but it's the best financial game in 150 years. We accept its flaws, including bailouts for too-big-to-fail companies.
Anyway.
SBF wanted Binance's bailout. Binance said no, which was good for the crypto market.
Free markets are resilient.
Nassim Nicholas Taleb coined the term antifragility.
“Some things benefit from shocks; they thrive and grow when exposed to volatility, randomness, disorder, and stressors and love adventure, risk, and uncertainty. Yet, in spite of the ubiquity of the phenomenon, there is no word for the exact opposite of fragile. Let us call it antifragile. Antifragility is beyond resilience or robustness. The resilient resists shocks and stays the same; the antifragile gets better.”
The easiest way to understand how antifragile systems behave is to compare them with other types of systems.
Glass is like a fragile system. It snaps when shocked.
Similar to rubber, a resilient system. After a stressful episode, it bounces back.
A system that is antifragile is similar to a muscle. As it is torn in the gym, it gets stronger.

Time-changed things are antifragile. Culture, tech innovation, restaurants, revolutions, book sales, cuisine, economic success, and even muscle shape. These systems benefit from shocks and randomness in different ways, but they all pay a price for antifragility.
Same goes for the free market and financial institutions. Taleb's book uses restaurants as an example and ends with a reference to the 2008 crash.
“Restaurants are fragile. They compete with each other. But the collective of local restaurants is antifragile for that very reason. Had restaurants been individually robust, hence immortal, the overall business would be either stagnant or weak and would deliver nothing better than cafeteria food — and I mean Soviet-style cafeteria food. Further, it [the overall business] would be marred with systemic shortages, with once in a while a complete crisis and government bailout.”
Imagine the same thing with banks.
Independent banks would compete to offer the best services. If one of these banks fails, it will disappear. Customers and investors will suffer, but the market will recover from the dead banks' mistakes.
This idea underpins a free market. Bitcoin and other cryptocurrencies say this when criticizing traditional banking.
The traditional banking system's components never die. When a bank fails, the Federal Reserve steps in with a big taxpayer-funded check. This hinders bank evolution. If you don't let banking cells die and be replaced, your financial system won't be antifragile.
The interdependence of banks (centralization) means that one bank's mistake can sink the entire fleet, which brings us to SBF's ultimate travesty with FTX.
FTX has left the cryptocurrency gene pool.
FTX should be decentralized and independent. The super-star scammer invested in more than 130 crypto companies and linked them, creating a fragile banking-like structure. FTX seemed to say, "We exist because centralized banks are bad." But we'll be good, unlike the centralized banking system.
FTX saved several companies, including BlockFi and Voyager Digital.
FTX wanted to be a crypto bank conglomerate and Federal Reserve. SBF wanted to monopolize crypto markets. FTX wanted to be in bed with as many powerful people as possible, so SBF seduced politicians and celebrities.
Worst? People who saw SBF's plan flaws praised him. Experts, newspapers, and crypto fans praised FTX. When billions pour in, it's hard to realize FTX was acting against its nature.
Then, they act shocked when they realize FTX's fall triggered a domino effect. Some say the damage could wipe out the crypto market, but that's wrong.
Cell death is different from body death.
FTX is out of the game despite its size. Unfit, it fell victim to market natural selection.
Next?
The challengers keep coming. The crypto economy will improve with each failure.
Free markets are antifragile because their fragile parts compete, fostering evolution. With constructive feedback, evolution benefits customers and investors.
FTX shows that customers don't like being scammed, so the crypto market's health depends on them. Charlatans and con artists are eliminated quickly or slowly.
Crypto isn't immune to collapse. Cryptocurrencies can go extinct like biological species. Antifragility isn't immortality. A few more decades of evolution may be enough for humans to figure out how to best handle money, whether it's bitcoin, traditional banking, gold, or something else.
Keep your BS detector on. Start by being skeptical of this article's finance-related claims. Even if you think you understand finance, join the conversation.
We build a better future through dialogue. So listen, ask, and share. When you think you can't find common ground with the opposing view, remember:
Sam Bankman-Fried lied.
You might also like

Sammy Abdullah
3 years ago
How to properly price SaaS
Price Intelligently put out amazing content on pricing your SaaS product. This blog's link to the whole report is worth reading. Our key takeaways are below.

Don't base prices on the competition. Competitor-based pricing has clear drawbacks. Their pricing approach is yours. Your company offers customers something unique. Otherwise, you wouldn't create it. This strategy is static, therefore you can't add value by raising prices without outpricing competitors. Look, but don't touch is the competitor-based moral. You want to know your competitors' prices so you're in the same ballpark, but they shouldn't guide your selections. Competitor-based pricing also drives down prices.
Value-based pricing wins. This is customer-based pricing. Value-based pricing looks outward, not inward or laterally at competitors. Your clients are the best source of pricing information. By valuing customer comments, you're focusing on buyers. They'll decide if your pricing and packaging are right. In addition to asking consumers about cost savings or revenue increases, look at data like number of users, usage per user, etc.
Value-based pricing increases prices. As you learn more about the client and your worth, you'll know when and how much to boost rates. Every 6 months, examine pricing.
Cloning top customers. You clone your consumers by learning as much as you can about them and then reaching out to comparable people or organizations. You can't accomplish this without knowing your customers. Segmenting and reproducing them requires as much detail as feasible. Offer pricing plans and feature packages for 4 personas. The top plan should state Contact Us. Your highest-value customers want more advice and support.
Question your 4 personas. What's the one item you can't live without? Which integrations matter most? Do you do analytics? Is support important or does your company self-solve? What's too cheap? What's too expensive?
Not everyone likes per-user pricing. SaaS organizations often default to per-user analytics. About 80% of companies utilizing per-user pricing should use an alternative value metric because their goods don't give more value with more users, so charging for them doesn't make sense.
At least 3:1 LTV/CAC. Break even on the customer within 2 years, and LTV to CAC is greater than 3:1. Because customer acquisition costs are paid upfront but SaaS revenues accrue over time, SaaS companies face an early financial shortfall while paying back the CAC.
ROI should be >20:1. Indeed. Ensure the customer's ROI is 20x the product's cost. Microsoft Office costs $80 a year, but consumers would pay much more to maintain it.
A/B Testing. A/B testing is guessing. When your pricing page varies based on assumptions, you'll upset customers. You don't have enough customers anyway. A/B testing optimizes landing pages, design decisions, and other site features when you know the problem but not pricing.
Don't discount. It cheapens the product, makes it permanent, and increases churn. By discounting, you're ruining your pricing analysis.
Matt Nutsch
3 years ago
Most people are unaware of how artificial intelligence (A.I.) is changing the world.

Recently, I saw an interesting social media post. In an entrepreneurship forum. A blogger asked for help because he/she couldn't find customers. I now suspect that the writer’s occupation is being disrupted by A.I.
Introduction
Artificial Intelligence (A.I.) has been a hot topic since the 1950s. With recent advances in machine learning, A.I. will touch almost every aspect of our lives. This article will discuss A.I. technology and its social and economic implications.
What's AI?
A computer program or machine with A.I. can think and learn. In general, it's a way to make a computer smart. Able to understand and execute complex tasks. Machine learning, NLP, and robotics are common types of A.I.
AI's global impact

AI will change the world, but probably faster than you think. A.I. already affects our daily lives. It improves our decision-making, efficiency, and productivity.
A.I. is transforming our lives and the global economy. It will create new business and job opportunities but eliminate others. Affected workers may face financial hardship.
AI examples:
OpenAI's GPT-3 text-generation

Developers can train, deploy, and manage models on GPT-3. It handles data preparation, model training, deployment, and inference for machine learning workloads. GPT-3 is easy to use for both experienced and new data scientists.
My team conducted an experiment. We needed to generate some blog posts for a website. We hired a blogger on Upwork. OpenAI created a blog post. The A.I.-generated blog post was of higher quality and lower cost.
MidjourneyAI's Art Contests

AI already affects artists. Artists use A.I. to create realistic 3D images and videos for digital art. A.I. is also used to generate new art ideas and methods.
MidjourneyAI and GigapixelAI won a contest last month. It's AI. created a beautiful piece of art that captured the contest's spirit. AI triumphs. It could open future doors.
After the art contest win, I registered to try out these new image generating A.I.s. In the MidjourneyAI chat forum, I noticed an artist's plea. The artist begged others to stop flooding RedBubble with AI-generated art.
Shutterstock and Getty Images have halted user uploads. AI-generated images flooded online marketplaces.
Imagining Videos with Meta

Meta released Make-a-Video this week. It's an A.I. app that creates videos from text. What you type creates a video.
This technology will impact TV, movies, and video games greatly. Imagine a movie or game that's personalized to your tastes. It's closer than you think.
Uses and Abuses of Deepfakes

Deepfake videos are computer-generated images of people. AI creates realistic images and videos of people.
Deepfakes are entertaining but have social implications. Porn introduced deepfakes in 2017. People put famous faces on porn actors and actresses without permission.
Soon, deepfakes were used to show dead actors/actresses or make them look younger. Carrie Fischer was included in films after her death using deepfake technology.
Deepfakes can be used to create fake news or manipulate public opinion, according to an AI.
Voices for Darth Vader and Iceman
James Earl Jones, who voiced Darth Vader, sold his voice rights this week. Aged actor won't be in those movies. Respeecher will use AI to mimic Jones's voice. This technology could change the entertainment industry. One actor can now voice many characters.

AI can generate realistic voice audio from text. Top Gun 2 actor Val Kilmer can't speak for medical reasons. Sonantic created Kilmer's voice from the movie script. This entertaining technology has social implications. It blurs authentic recordings and fake media.
Medical A.I. fights viruses

A team of Chinese scientists used machine learning to predict effective antiviral drugs last year. They started with a large dataset of virus-drug interactions. Researchers combined that with medication and virus information. Finally, they used machine learning to predict effective anti-virus medicines. This technology could solve medical problems.
AI ideas AI-generated Itself

OpenAI's GPT-3 predicted future A.I. uses. Here's what it told me:
AI will affect the economy. Businesses can operate more efficiently and reinvest resources with A.I.-enabled automation. AI can automate customer service tasks, reducing costs and improving satisfaction.
A.I. makes better pricing, inventory, and marketing decisions. AI automates tasks and makes decisions. A.I.-powered robots could help the elderly or disabled. Self-driving cars could reduce accidents.
A.I. predictive analytics can predict stock market or consumer behavior trends and patterns. A.I. also personalizes recommendations. sways. A.I. recommends products and movies. AI can generate new ideas based on data analysis.
Conclusion

A.I. will change business as it becomes more common. It will change how we live and work by creating growth and prosperity.
Exciting times, but also one which should give us all pause. Technology can be good or evil. We must use new technologies ethically, fairly, and honestly.
“The author generated some sentences in this text in part with GPT-3, OpenAI’s large-scale language-generation model. Upon generating draft language, the author reviewed, edited, and revised the language to their own liking and takes ultimate responsibility for the content of this publication. The text of this post was further edited using HemingWayApp. Many of the images used were generated using A.I. as described in the captions.”

Owolabi Judah
3 years ago
How much did YouTube pay for 10 million views?
Ali's $1,054,053.74 YouTube Adsense haul.

YouTuber, entrepreneur, and former doctor Ali Abdaal. He began filming productivity and financial videos in 2017. Ali Abdaal has 3 million YouTube subscribers and has crossed $1 million in AdSense revenue. Crazy, no?
Ali will share the revenue of his top 5 youtube videos, things he's learned that you can apply to your side hustle, and how many views it takes to make a livelihood off youtube.
First, "The Long Game."
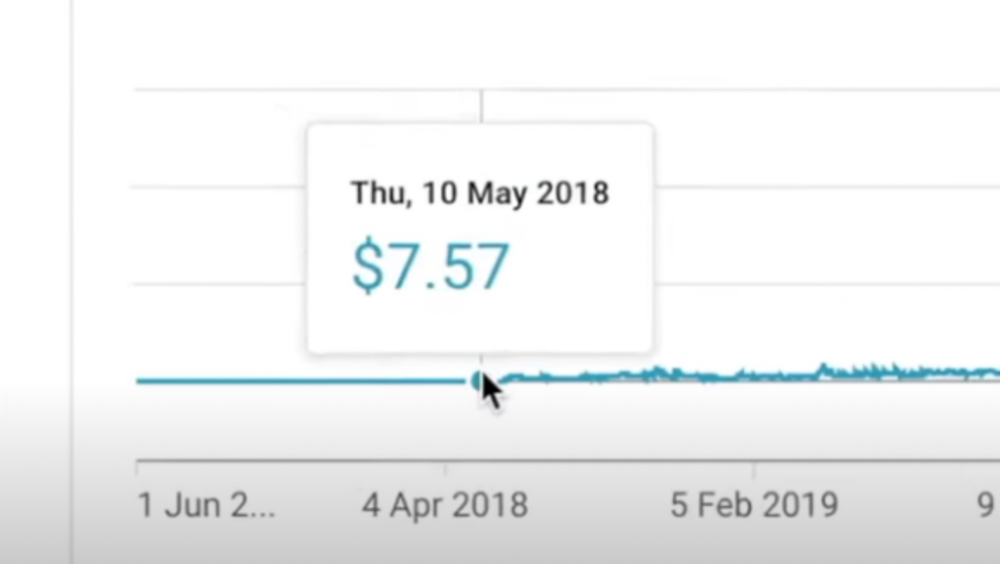
All good things take time to bear fruit. Compounding improves everything. Long-term work yields better returns. Ali made his first dollar after nine months and 85 videos.
Second, "One piece of content can transform your life, but you never know which one."
Had he abandoned YouTube at 84 videos without making any money, he wouldn't have filmed the 85th video that altered everything.
Third Lesson: Your Industry Choice Can Multiply.
The industry or niche you target as a business owner or side hustler can have a major impact on how much money you make.
Here are the top 5 videos.

1) 9.8m views: $191,258.16 for 9 passive income ideas
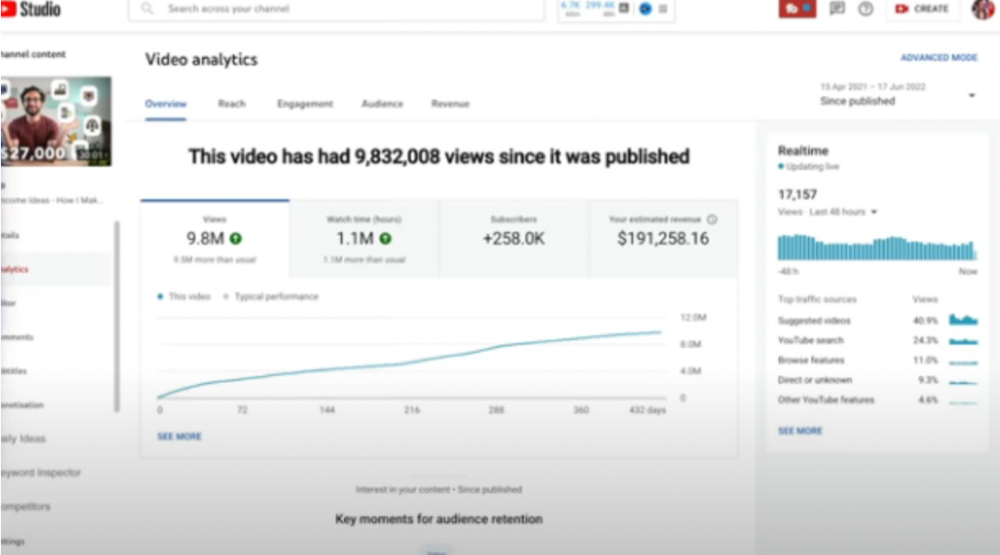
Ali made 2 points.
We should consider YouTube videos digital assets. They're investments, which make us money. His investments are yielding passive income.
Investing extra time and effort in your films can pay off.
2) How to Invest for Beginners — 5.2m Views: $87,200.08.
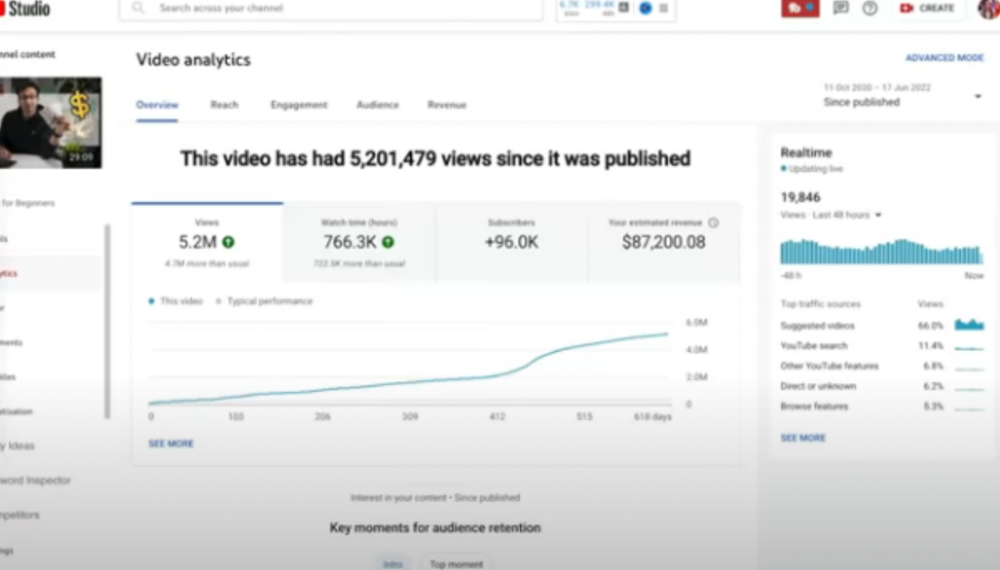
This video did poorly in the first several weeks after it was published; it was his tenth poorest performer. Don't worry about things you can't control. This applies to life, not just YouTube videos.
He stated we constantly have anxieties, fears, and concerns about things outside our control, but if we can find that line, life is easier and more pleasurable.
3) How to Build a Website in 2022— 866.3k views: $42,132.72.
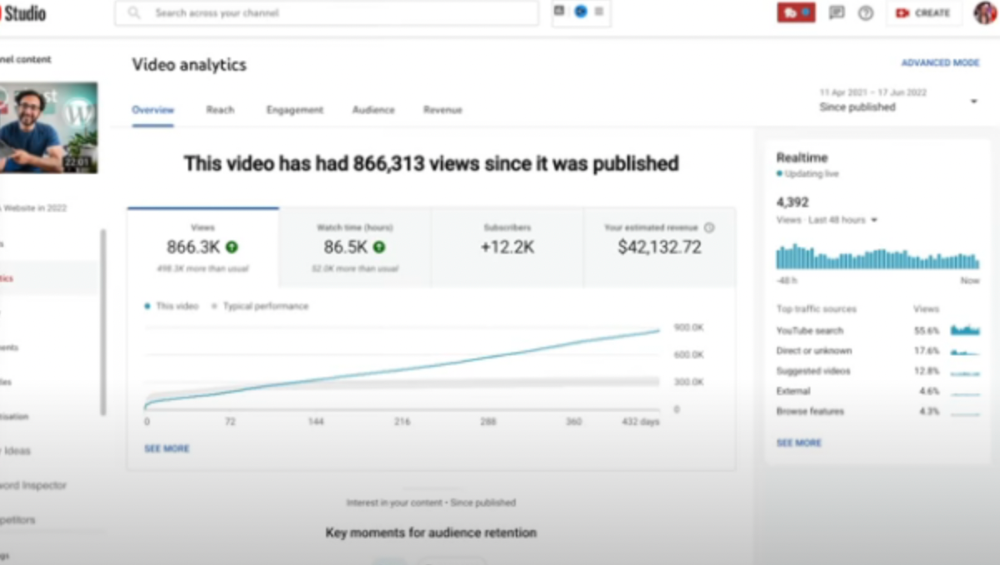
The RPM was $48.86 per thousand views, making it his highest-earning video. Squarespace, Wix, and other website builders are trying to put ads on it and competing against one other, so ad rates go up.
Because it was beyond his niche, Ali almost didn't make the video. He made the video because he wanted to help at least one person.
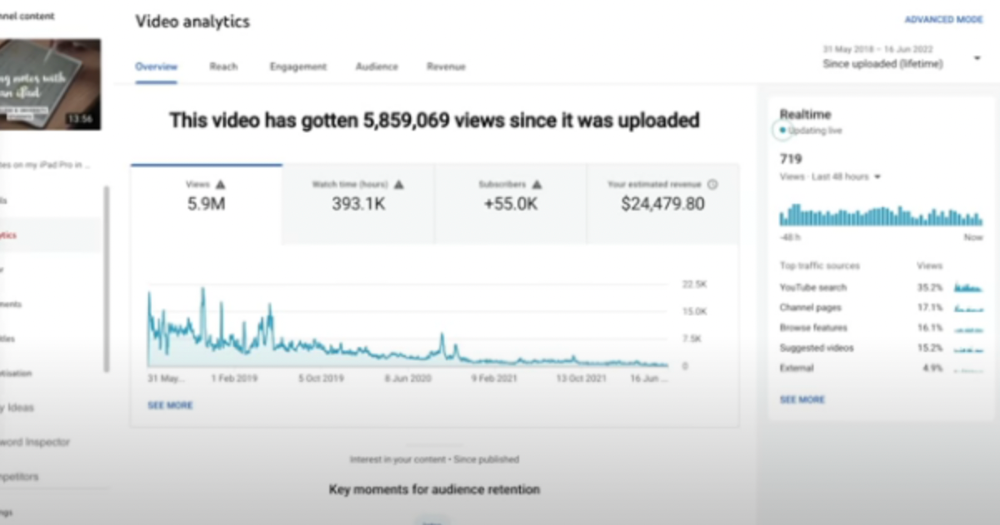
4) How I take notes on my iPad in medical school — 5.9m views: $24,479.80

85th video. It's the video that affected Ali's YouTube channel and his life the most. The video's success wasn't certain.
5) How I Type Fast 156 Words Per Minute — 8.2M views: $25,143.17
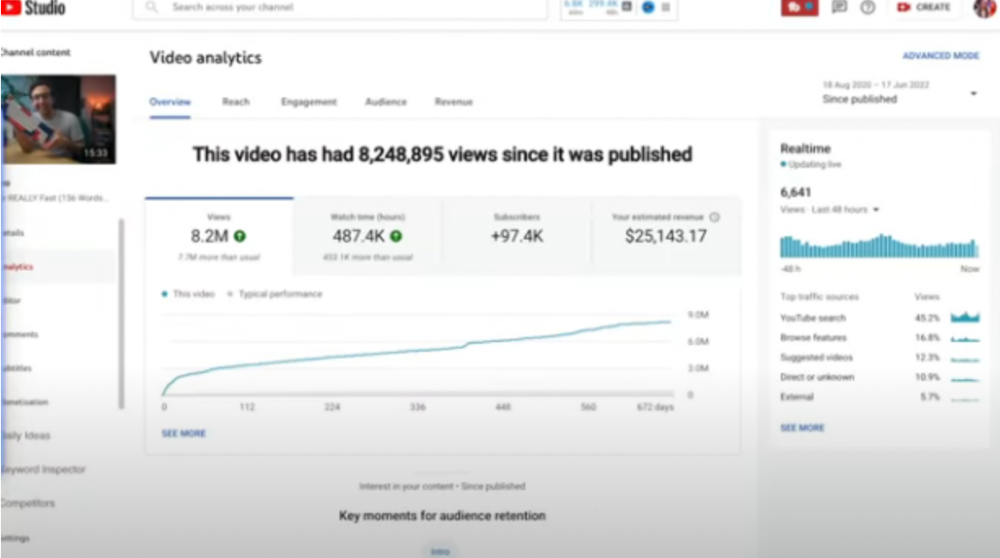
Ali didn't know this video would perform well; he made it because he can type fast and has been practicing for 10 years. So he made a video with his best advice.
How many views to different wealth levels?
It depends on geography, niche, and other monetization sources. To keep things simple, he would solely utilize AdSense.
How many views to generate money?

To generate money on Youtube, you need 1,000 subscribers and 4,000 hours of view time. How much work do you need to make pocket money?

Ali's first 1,000 subscribers took 52 videos and 6 months. The typical channel with 1,000 subscribers contains 152 videos, according to Tubebuddy. It's time-consuming.
After monetizing, you'll need 15,000 views/month to make $5-$10/day.
How many views to go part-time?

Say you make $35,000/year at your day job. If you work 5 days/week, you make $7,000/year each day. If you want to drop down from 5 days to 4 days/week, you need to make an extra $7,000/year from YouTube, or $600/month.
What's the quit-your-job budget?

Silicon Valley Girl is in a highly successful niche targeting tech-focused folks in the west. When her channel had 500k views/month, she made roughly $3,000/month or $47,000/year, enough to quit your work.
Marina has another 1.5m subscriber channel in Russia, which has a lower rpm because fewer corporations advertise there than in the west. 2.3 million views/month is $4,000/month or $50,000/year, enough to quit your employment.

Marina is an intriguing example because she has three YouTube channels with the same skills, but one is 16x more profitable due to the niche she chose.
In Ali's case, he made 100+ videos when his channel was producing enough money to quit his job, roughly $4,000/month.
How many views make you rich?

Depending on how you define rich. Ali felt prosperous with over $100,000/year and 3–5m views/month.
Conclusion
YouTubers and artists don't treat their work like a company, which is a mistake. Businesses have been attempting to figure this out for decades, if not centuries.
We can learn from the business world how to monetize YouTube, Instagram, and Tiktok and make them into sustainable enterprises where we can hire people and delegate tasks.
Bonus
Watch Ali's video explaining all this:
This post is a summary. Read the full article here