


More on Web3 & Crypto

Koji Mochizuki
4 years ago
How to Launch an NFT Project by Yourself
Creating 10,000 auto-generated artworks, deploying a smart contract to the Ethereum / Polygon blockchain, setting up some tools, etc.
There is so much to do from launching to running an NFT project. Creating parts for artworks, generating 10,000 unique artworks and metadata, creating a smart contract and deploying it to a blockchain network, creating a website, creating a Twitter account, setting up a Discord server, setting up an OpenSea collection. In addition, you need to have MetaMask installed in your browser and have some ETH / MATIC. Did you get tired of doing all this? Don’t worry, once you know what you need to do, all you have to do is do it one by one.
To be honest, it’s best to run an NFT project in a team of three or more, including artists, developers, and marketers. However, depending on your motivation, you can do it by yourself. Some people might come later to offer help with your project. The most important thing is to take a step as soon as possible.
Creating Parts for Artworks
There are lots of free/paid software for drawing, but after all, I think Adobe Illustrator or Photoshop is the best. The images of Skulls In Love are a composite of 48x48 pixel parts created using Photoshop.
The most important thing in creating parts for generative art is to repeatedly test what your artworks will look like after each layer has been combined. The generated artworks should not be too unnatural.
How Many Parts Should You Create?
Are you wondering how many parts you should create to avoid duplication as much as possible when generating your artworks? My friend Stephane, a developer, has created a great tool to help with that.
Generating 10,000 Unique Artworks and Metadata
I highly recommend using the HashLips Art Engine to generate your artworks and metadata. Perhaps there is no better artworks generation tool at the moment.
GitHub: https://github.com/HashLips/hashlips_art_engine
YouTube:
Storing Artworks and Metadata
Ideally, the generated artworks and metadata should be stored on-chain, but if you want to store them off-chain, you should use IPFS. Do not store in centralized storage. This is because data will be lost if the server goes down or if the company goes down. On the other hand, IPFS is a more secure way to find data because it utilizes a distributed, decentralized system.
Storing to IPFS is easy with Pinata, NFT.Storage, and so on. The Skulls In Love uses Pinata. It’s very easy to use, just upload the folder containing your artworks.
Creating and Deploying a Smart Contract
You don’t have to create a smart contract from scratch. There are many great NFT projects, many of which publish their contract source code on Etherscan / PolygonScan. You can choose the contract you like and reuse it. Of course, that requires some knowledge of Solidity, but it depends on your efforts. If you don’t know which contract to choose, use the HashLips smart contract. It’s very simple, but it has almost all the functions you need.
GitHub: https://github.com/HashLips/hashlips_nft_contract
Note: Later on, you may want to change the cost value. You can change it on Remix or Etherscan / PolygonScan. But in this case, enter the Wei value instead of the Ether value. For example, if you want to sell for 1 MATIC, you have to enter “1000000000000000000”. If you set this value to “1”, you will have a nightmare. I recommend using Simple Unit Converter as a tool to calculate the Wei value.
Creating a Website
The website here is not just a static site to showcase your project, it’s a so-called dApp that allows you to access your smart contract and mint NFTs. In fact, this level of dApp is not too difficult for anyone who has ever created a website. Because the ethers.js / web3.js libraries make it easy to interact with your smart contract. There’s also no problem connecting wallets, as MetaMask has great documentation.
The Skulls In Love uses a simple, fast, and modern dApp that I built from scratch using Next.js. It is published on GitHub, so feel free to use it.
Why do people mint NFTs on a website?
Ethereum’s gas fees are high, so if you mint all your NFTs, there will be a huge initial cost. So it makes sense to get the buyers to help with the gas fees for minting.
What about Polygon? Polygon’s gas fees are super cheap, so even if you mint 10,000 NFTs, it’s not a big deal. But we don’t do that. Since NFT projects are a kind of game, it involves the fun of not knowing what will come out after minting.
Creating a Twitter Account
I highly recommend creating a Twitter account. Twitter is an indispensable tool for announcing giveaways and reaching more people. It’s better to announce your project and your artworks little by little, 1–2 weeks before launching your project.
Creating and Setting Up a Discord Server
I highly recommend creating a Discord server as well as a Twitter account. The Discord server is a community and its home. Fans of your NFT project will want to join your community and interact with many other members. So, carefully create each channel on your Discord server to make it a cozy place for your community members.
If you are unfamiliar with Discord, you may be particularly confused by the following:
What bots should I use?
How should I set roles and permissions?
But don’t worry. There are lots of great YouTube videos and blog posts about these.
It’s also a good idea to join the Discord servers of some NFT projects and see how they’re made. Our Discord server is so simple that even beginners will find it easy to understand. Please join us and see it!
Note: First, create a test account and a test server to make sure your bots and permissions work properly. It is better to verify the behavior on the test server before setting up your production server.
UPDATED: As your Discord server grows, you cannot manage it on your own. In this case, you will be hiring several moderators, but choose carefully before hiring. And don’t give them important role permissions right after hiring. Initially, the same permissions as other members are sufficient. After a while, you can add permissions as needed, such as kicking/banning, using the “@every” tag, and adding roles. Again, don’t immediately give significant permissions to your Mod role. Your server can be messed up by fake moderators.
Setting Up Your OpenSea Collection
Before you start selling your NFTs, you need to reserve some for airdrops, giveaways, staff, and more. It’s up to you whether it’s 100, 500, or how many.
After minting some of your NFTs, your account and collection should have been created in OpenSea. Go to OpenSea, connect to your wallet, and set up your collection. Just set your logo, banner image, description, links, royalties, and more. It’s not that difficult.
Promoting Your Project
After all, promotion is the most important thing. In fact, almost every successful NFT project spends a lot of time and effort on it.
In addition to Twitter and Discord, it’s even better to use Instagram, Reddit, and Medium. Also, register your project in NFTCalendar and DISBOARD
DISBOARD is the public Discord server listing community.
About Promoters
You’ll probably get lots of contacts from promoters on your Discord, Twitter, Instagram, and more. But most of them are scams, so don’t pay right away. If you have a promoter that looks attractive to you, be sure to check the promoter’s social media accounts or website to see who he/she is. They basically charge in dollars. The amount they charge isn’t cheap, but promoters with lots of followers may have some temporary effect on your project. Some promoters accept 50% prepaid and 50% postpaid. If you can afford it, it might be worth a try. I never ask them, though.
When Should the Promotion Activities Start?
You may be worried that if you promote your project before it starts, someone will copy your project (artworks). It is true that some projects have actually suffered such damage. I don’t have a clear answer to this question right now, but:
- Do not publish all the information about your project too early
- The information should be released little by little
- Creating artworks that no one can easily copy
I think these are important.
If anyone has a good idea, please share it!
About Giveaways
When hosting giveaways, you’ll probably use multiple social media platforms. You may want to grow your Discord server faster. But if joining the Discord server is included in the giveaway requirements, some people hate it. I recommend holding giveaways for each platform. On Twitter and Reddit, you should just add the words “Discord members-only giveaway is being held now! Please join us if you like!”.
If you want to easily pick a giveaway winner in your browser, I recommend Twitter Picker.
Precautions for Distributing Free NFTs
If you want to increase your Twitter followers and Discord members, you can actually get a lot of people by holding events such as giveaways and invite contests. However, distributing many free NFTs at once can be dangerous. Some people who want free NFTs, as soon as they get a free one, sell it at a very low price on marketplaces such as OpenSea. They don’t care about your project and are only thinking about replacing their own “free” NFTs with Ethereum. The lower the floor price of your NFTs, the lower the value of your NFTs (project). Try to think of ways to get people to “buy” your NFTs as much as possible.
Ethereum vs. Polygon
Even though Ethereum has high gas fees, NFT projects on the Ethereum network are still mainstream and popular. On the other hand, Polygon has very low gas fees and fast transaction processing, but NFT projects on the Polygon network are not very popular.
Why? There are several reasons, but the biggest one is that it’s a lot of work to get MATIC (on Polygon blockchain, use MATIC instead of ETH) ready to use. Simply put, you need to bridge your tokens to the Polygon chain. So people need to do this first before minting your NFTs on your website. It may not be a big deal for those who are familiar with crypto and blockchain, but it may be complicated for those who are not. I hope that the tedious work will be simplified in the near future.
If you are confident that your NFTs will be purchased even if they are expensive, or if the total supply of your NFTs is low, you may choose Ethereum. If you just want to save money, you should choose Polygon. Keep in mind that gas fees are incurred not only when minting, but also when performing some of your smart contract functions and when transferring your NFTs.
If I were to launch a new NFT project, I would probably choose Ethereum or Solana.
Conclusion
Some people may want to start an NFT project to make money, but don’t forget to enjoy your own project. Several months ago, I was playing with creating generative art by imitating the CryptoPunks. I found out that auto-generated artworks would be more interesting than I had imagined, and since then I’ve been completely absorbed in generative art.
This is one of the Skulls In Love artworks:
This character wears a cowboy hat, black slim sunglasses, and a kimono. If anyone looks like this, I can’t help laughing!
The Skulls In Love NFTs can be minted for a small amount of MATIC on the official website. Please give it a try to see what kind of unique characters will appear 💀💖
Thank you for reading to the end. I hope this article will be helpful to those who want to launch an NFT project in the future ✨

The Verge
3 years ago
Bored Ape Yacht Club creator raises $450 million at a $4 billion valuation.
Yuga Labs, owner of three of the biggest NFT brands on the market, announced today a $450 million funding round. The money will be used to create a media empire based on NFTs, starting with games and a metaverse project.
The team's Otherside metaverse project is an MMORPG meant to connect the larger NFT universe. They want to create “an interoperable world” that is “gamified” and “completely decentralized,” says Wylie Aronow, aka Gordon Goner, co-founder of Bored Ape Yacht Club. “We think the real Ready Player One experience will be player run.”
Just a few weeks ago, Yuga Labs announced the acquisition of CryptoPunks and Meebits from Larva Labs. The deal brought together three of the most valuable NFT collections, giving Yuga Labs more IP to work with when developing games and metaverses. Last week, ApeCoin was launched as a cryptocurrency that will be governed independently and used in Yuga Labs properties.
Otherside will be developed by “a few different game studios,” says Yuga Labs CEO Nicole Muniz. The company plans to create development tools that allow NFTs from other projects to work inside their world. “We're welcoming everyone into a walled garden.”
However, Yuga Labs believes that other companies are approaching metaverse projects incorrectly, allowing the startup to stand out. People won't bond spending time in a virtual space with nothing going on, says Yuga Labs co-founder Greg Solano, aka Gargamel. Instead, he says, people bond when forced to work together.
In order to avoid getting smacked, Solano advises making friends. “We don't think a Zoom chat and walking around saying ‘hi' creates a deep social experience.” Yuga Labs refused to provide a release date for Otherside. Later this year, a play-to-win game is planned.
The funding round was led by Andreessen Horowitz, a major investor in the Web3 space. It previously backed OpenSea and Coinbase. Animoca Brands, Coinbase, and MoonPay are among those who have invested. Andreessen Horowitz general partner Chris Lyons will join Yuga Labs' board. The Financial Times broke the story last month.
"META IS A DOMINANT DIGITAL EXPERIENCE PROVIDER IN A DYSTOPIAN FUTURE."
This emerging [Web3] ecosystem is important to me, as it is to companies like Meta,” Chris Dixon, head of Andreessen Horowitz's crypto arm, tells The Verge. “In a dystopian future, Meta is the dominant digital experience provider, and it controls all the money and power.” (Andreessen Horowitz co-founder Marc Andreessen sits on Meta's board and invested early in Facebook.)
Yuga Labs has been profitable so far. According to a leaked pitch deck, the company made $137 million last year, primarily from its NFT brands, with a 95% profit margin. (Yuga Labs declined to comment on deck figures.)
But the company has built little so far. According to OpenSea data, it has only released one game for a limited time. That means Yuga Labs gets hundreds of millions of dollars to build a gaming company from scratch, based on a hugely lucrative art project.
Investors fund Yuga Labs based on its success. That's what they did, says Dixon, “they created a culture phenomenon”. But ultimately, the company is betting on the same thing that so many others are: that a metaverse project will be the next big thing. Now they must construct it.

TheRedKnight
3 years ago
Say goodbye to Ponzi yields - A new era of decentralized perpetual
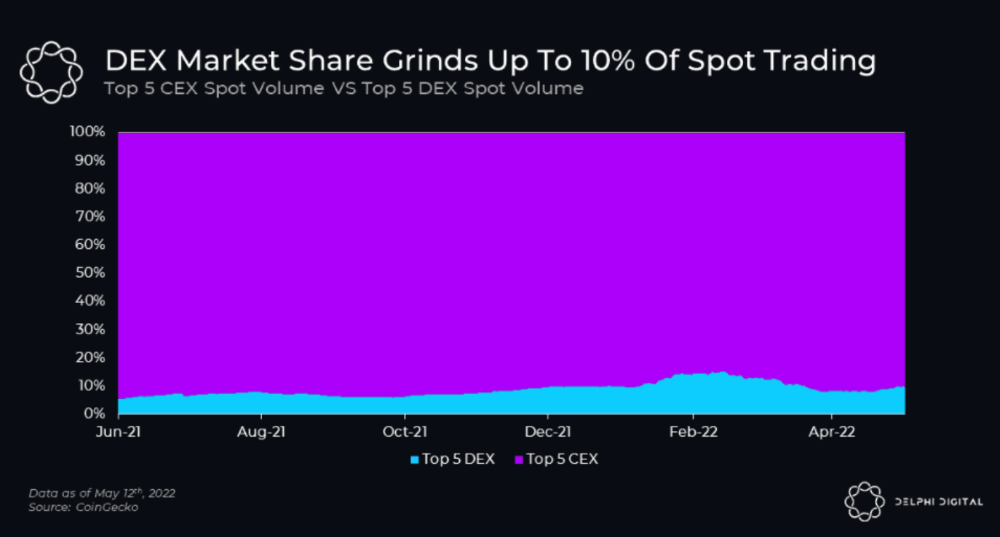
Decentralized perpetual may be the next crypto market boom; with tons of perpetual popping up, let's look at two protocols that offer organic, non-inflationary yields.
Decentralized derivatives exchanges' market share has increased tenfold in a year, but it's still 2% of CEXs'. DEXs have a long way to go before they can compete with centralized exchanges in speed, liquidity, user experience, and composability.
I'll cover gains.trade and GMX protocol in Polygon, Avalanche, and Arbitrum. Both protocols support leveraged perpetual crypto, stock, and Forex trading.
Why these protocols?
Decentralized GMX Gains protocol
Organic yield: path to sustainability
I've never trusted Defi's non-organic yields. Example: XYZ protocol. 20–75% of tokens may be set aside as farming rewards to provide liquidity, according to tokenomics.
Say you provide ETH-USDC liquidity. They advertise a 50% APR reward for this pair, 10% from trading fees and 40% from farming rewards. Only 10% is real, the rest is "Ponzi." The "real" reward is in protocol tokens.
Why keep this token? Governance voting or staking rewards are promoted services.
Most liquidity providers expect compensation for unused tokens. Basic psychological principles then? — Profit.
Nobody wants governance tokens. How many out of 100 care about the protocol's direction and will vote?
Staking increases your token's value. Currently, they're mostly non-liquid. If the protocol is compromised, you can't withdraw funds. Most people are sceptical of staking because of this.
"Free tokens," lack of use cases, and skepticism lead to tokens moving south. No farming reward protocols have lasted.
It may have shown strength in a bull market, but what about a bear market?
What is decentralized perpetual?
A perpetual contract is a type of futures contract that doesn't expire. So one can hold a position forever.
You can buy/sell any leveraged instruments (Long-Short) without expiration.
In centralized exchanges like Binance and coinbase, fees and revenue (liquidation) go to the exchanges, not users.
Users can provide liquidity that traders can use to leverage trade, and the revenue goes to liquidity providers.
Gains.trade and GMX protocol are perpetual trading platforms with a non-inflationary organic yield for liquidity providers.
GMX protocol
GMX is an Arbitrum and Avax protocol that rewards in ETH and Avax. GLP uses a fast oracle to borrow the "true price" from other trading venues, unlike a traditional AMM.
GLP and GMX are protocol tokens. GLP is used for leveraged trading, swapping, etc.
GLP is a basket of tokens, including ETH, BTC, AVAX, stablecoins, and UNI, LINK, and Stablecoins.
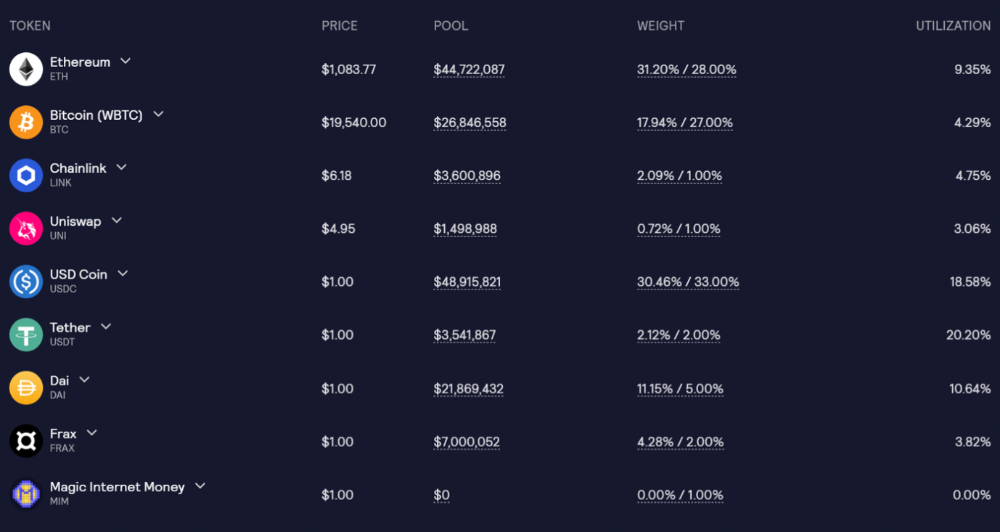
GLP composition on arbitrum
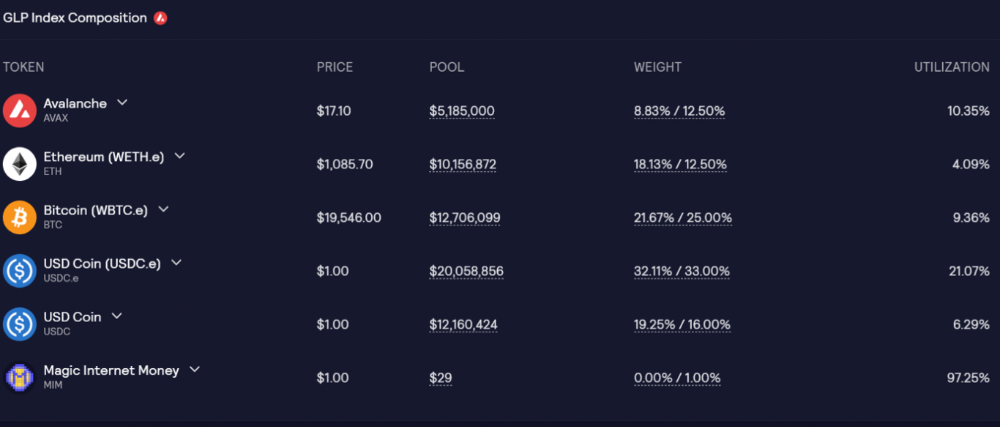
GLP composition on Avalanche
GLP token rebalances based on usage, providing liquidity without loss.
Protocol "runs" on Staking GLP. Depending on their chain, the protocol will reward users with ETH or AVAX. Current rewards are 22 percent (15.71 percent in ETH and the rest in escrowed GMX) and 21 percent (15.72 percent in AVAX and the rest in escrowed GMX). escGMX and ETH/AVAX percentages fluctuate.
Where is the yield coming from?
Swap fees, perpetual interest, and liquidations generate yield. 70% of fees go to GLP stakers, 30% to GMX. Organic yields aren't paid in inflationary farm tokens.
Escrowed GMX is vested GMX that unlocks in 365 days. To fully unlock GMX, you must farm the Escrowed GMX token for 365 days. That means less selling pressure for the GMX token.
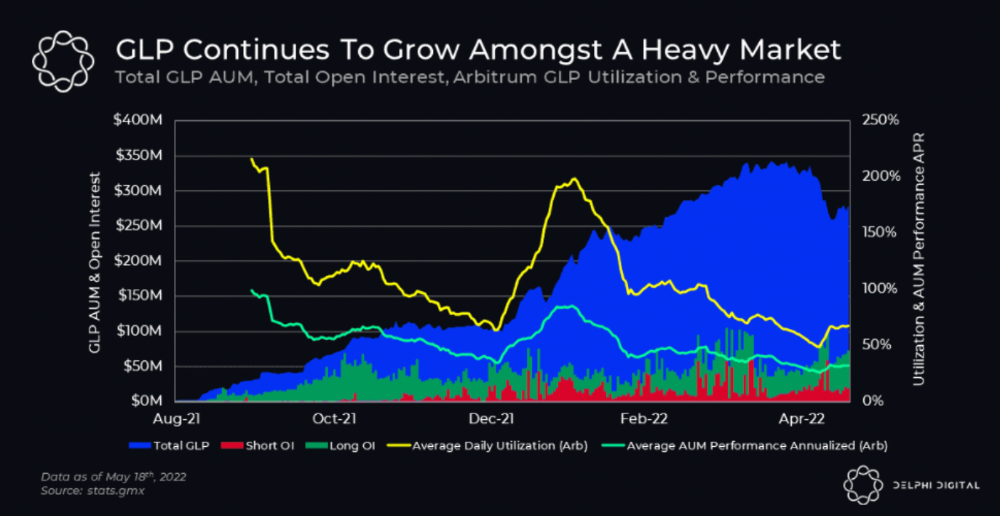
GMX's status
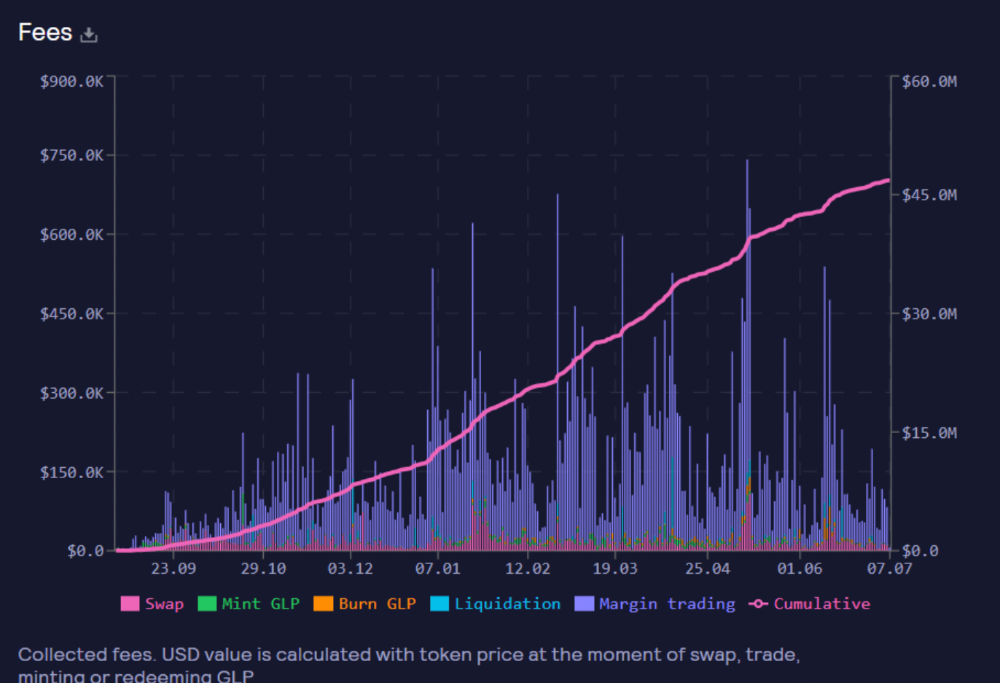
These are the fees in Arbitrum in the past 11 months by GMX.
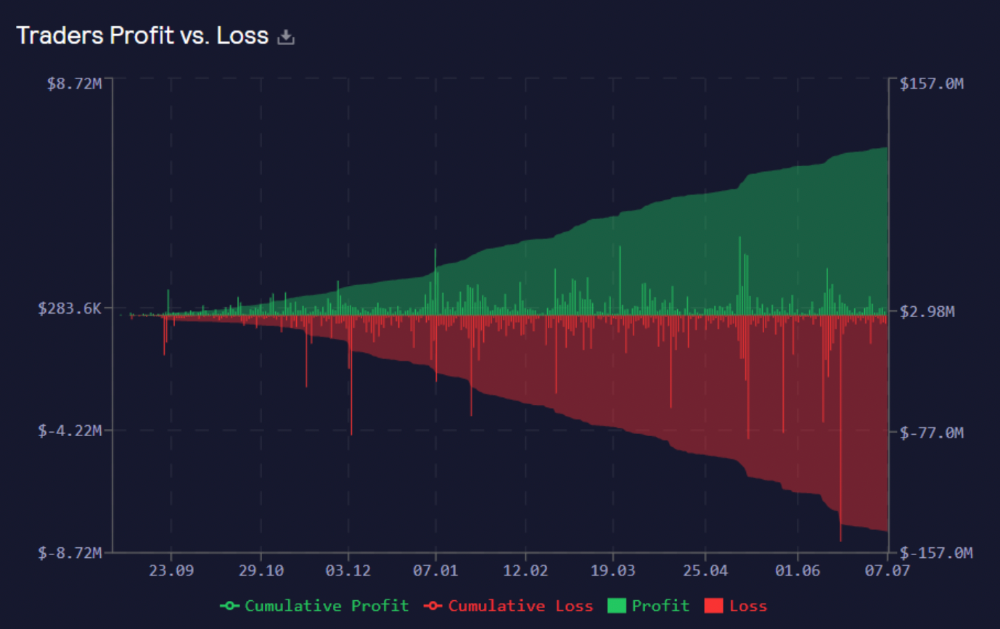
GMX works like a casino, which increases fees. Most fees come from Margin trading, which means most traders lose money; this money goes to the casino, or GLP stakers.
Strategies
My personal strategy is to DCA into GLP when markets hit bottom and stake it; GLP will be less volatile with extra staking rewards.
GLP YoY return vs. naked buying
Let's say I invested $10,000 in BTC, AVAX, and ETH in January.
BTC price: 47665$
ETH price: 3760$
AVAX price: $145
Current prices
BTC $21,000 (Down 56 percent )
ETH $1233 (Down 67.2 percent )
AVAX $20.36 (Down 85.95 percent )
Your $10,000 investment is now worth around $3,000.
How about GLP? My initial investment is 50% stables and 50% other assets ( Assuming the coverage ratio for stables is 50 percent at that time)
Without GLP staking yield, your value is $6500.
Let's assume the average APR for GLP staking is 23%, or $1500. So 8000$ total. It's 50% safer than holding naked assets in a bear market.
In a bull market, naked assets are preferable to GLP.
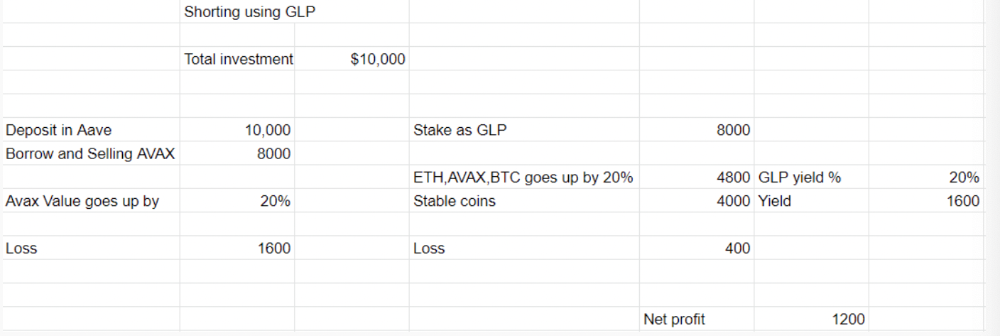
Short farming using GLP
Simple GLP short farming.
You use a stable asset as collateral to borrow AVAX. Sell it and buy GLP. Even if GLP rises, it won't rise as fast as AVAX, so we can get yields.
Let's do the maths
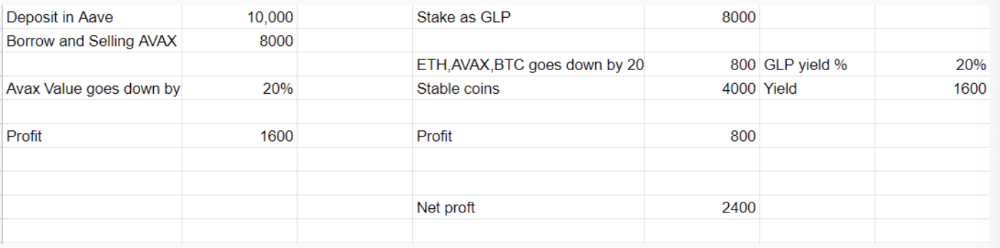
You deposit $10,000 USDT in Aave and borrow Avax. Say you borrow $8,000; you sell it, buy GLP, and risk 20%.
After a year, ETH, AVAX, and BTC rise 20%. GLP is $8800. $800 vanishes. 20% yields $1600. You're profitable. Shorting Avax costs $1600. (Assumptions-ETH, AVAX, BTC move the same, GLP yield is 20%. GLP has a 50:50 stablecoin/others ratio. Aave won't liquidate
In naked Avax shorting, Avax falls 20% in a year. You'll make $1600. If you buy GLP and stake it using the sold Avax and BTC, ETH and Avax go down by 20% - your profit is 20%, but with the yield, your total gain is $2400.
Issues with GMX
GMX's historical funding rates are always net positive, so long always pays short. This makes long-term shorts less appealing.
Oracle price discovery isn't enough. This limitation doesn't affect Bitcoin and ETH, but it affects less liquid assets. Traders can buy and sell less liquid assets at a lower price than their actual cost as long as GMX exists.
As users must provide GLP liquidity, adding more assets to GMX will be difficult. Next iteration will have synthetic assets.
Gains Protocol
Best leveraged trading platform. Smart contract-based decentralized protocol. 46 crypto pairs can be leveraged 5–150x and 10 Forex pairs 5–1000x. $10 DAI @ 150x (min collateral x leverage pos size is $1500 DAI). No funding fees, no KYC, trade DAI from your wallet, keep funds.
DAI single-sided staking and the GNS-DAI pool are important parts of Gains trading. GNS-DAI stakers get 90% of trading fees and 100% swap fees. 10 percent of trading fees go to DAI stakers, which is currently 14 percent!
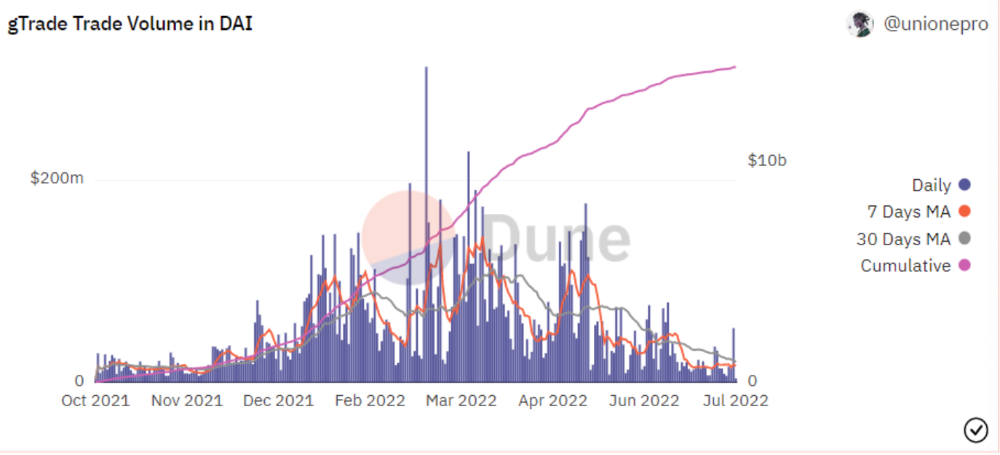
Trade volume
When a trader opens a trade, the leverage and profit are pulled from the DAI pool. If he loses, the protocol yield goes to the stakers.
If the trader's win rate is high and the DAI pool slowly depletes, the GNS token is minted and sold to refill DAI. Trader losses are used to burn GNS tokens. 25%+ of GNS is burned, making it deflationary.
Due to high leverage and volatility of crypto assets, most traders lose money and the protocol always wins, keeping GNS deflationary.
Gains uses a unique decentralized oracle for price feeds, which is better for leverage trading platforms. Let me explain.
Gains uses chainlink price oracles, not its own price feeds. Chainlink oracles only query centralized exchanges for price feeds every minute, which is unsuitable for high-precision trading.
Gains created a custom oracle that queries the eight chainlink nodes for the current price and, on average, for trade confirmation. This model eliminates every-second inquiries, which waste gas but are more efficient than chainlink's per-minute price.
This price oracle helps Gains open and close trades instantly, eliminate scam wicks, etc.
Other benefits include:
Stop-loss guarantee (open positions updated)
No scam wicks
Spot-pricing
Highest possible leverage
Fixed-spreads. During high volatility, a broker can increase the spread, which can hit your stop loss without the price moving.
Trade directly from your wallet and keep your funds.
>90% loss before liquidation (Some platforms liquidate as little as -50 percent)
KYC-free
Directly trade from wallet; keep funds safe
Further improvements
GNS-DAI liquidity providers fear the impermanent loss, so the protocol is migrating to its own liquidity and single staking GNS vaults. This allows users to stake GNS without permanent loss and obtain 90% DAI trading fees by staking. This starts in August.
Their upcoming improvements can be found here.
Gains constantly add new features and change pairs. It's an interesting protocol.
Conclusion
Next bull run, watch decentralized perpetual protocols. Effective tokenomics and non-inflationary yields may attract traders and liquidity providers. But still, there is a long way for them to develop, and I don't see them tackling the centralized exchanges any time soon until they fix their inherent problems and improve fast enough.
Read the full post here.
You might also like

Jano le Roux
3 years ago
Apple Quietly Introduces A Revolutionary Savings Account That Kills Banks
Would you abandon your bank for Apple?
Banks are struggling.
not as a result of inflation
not due to the economic downturn.
not due to the conflict in Ukraine.
But because they’re underestimating Apple.
Slowly but surely, Apple is looking more like a bank.
An easy new savings account like Apple
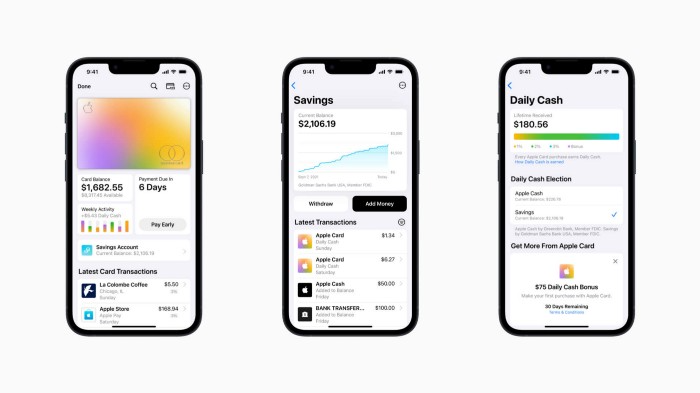
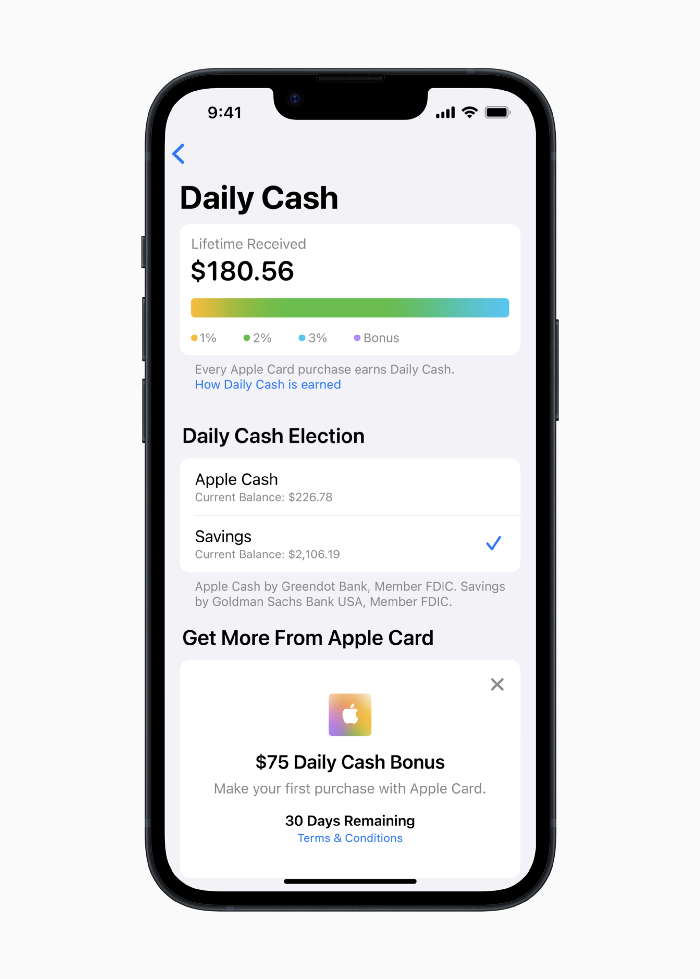
Apple has a new savings account.
Apple says Apple Card users may set up and manage savings straight in Wallet.
No more charges
Colorfully high yields
With no minimum balance
No minimal down payments
Most consumer-facing banks will have to match Apple's offer or suffer disruption.
Users may set it up from their iPhones without traveling to a bank or filling out paperwork.
It’s built into the iPhone in your pocket.
So now more waiting for slow approval processes.
Once the savings account is set up, Apple will automatically transfer all future Daily Cash into it. Users may also add these cash to an Apple Cash card in their Apple Wallet app and adjust where Daily Cash is paid at any time.
Apple Pay and Apple Wallet VP Jennifer Bailey:
Savings enables Apple Card users to grow their Daily Cash rewards over time, while also saving for the future.
Bailey says Savings adds value to Apple Card's Daily Cash benefit and offers another easy-to-use tool to help people lead healthier financial lives.
Transfer money from a linked bank account or Apple Cash to a Savings account. Users can withdraw monies to a connected bank account or Apple Cash card without costs.
Once set up, Apple Card customers can track their earnings via Wallet's Savings dashboard. This dashboard shows their account balance and interest.
This product targets younger people as the easiest way to start a savings account on the iPhone.
Why would a Gen Z account holder travel to the bank if their iPhone could be their bank?
Using this concept, Apple will transform the way we think about banking by 2030.
Two other nightmares keep bankers awake at night
Apple revealed two new features in early 2022 that banks and payment gateways hated.
Tap to Pay with Apple
Late Apple Pay
They startled the industry.
Tap To Pay converts iPhones into mobile POS card readers. Apple Pay Later is pushing the BNPL business in a consumer-friendly direction, hopefully ending dodgy lending practices.
Tap to Pay with Apple
iPhone POS
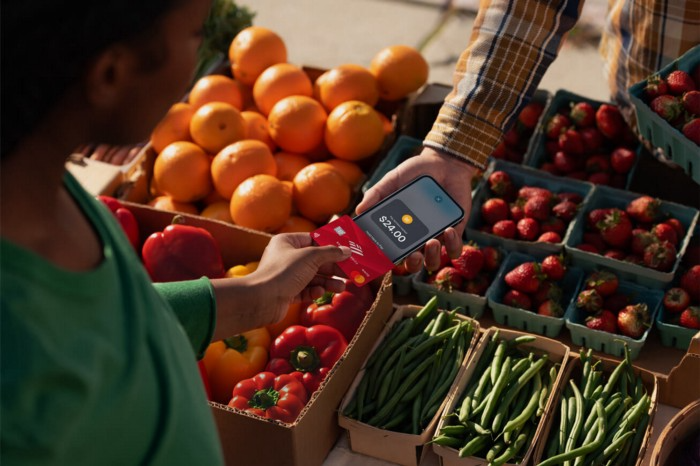
Millions of US merchants, from tiny shops to huge establishments, will be able to accept Apple Pay, contactless credit and debit cards, and other digital wallets with a tap.
No hardware or payment terminal is needed.
Revolutionary!
Stripe has previously launched this feature.
Tap to Pay on iPhone will provide companies with a secure, private, and quick option to take contactless payments and unleash new checkout experiences, said Bailey.
Apple's solution is ingenious. Brilliant!
Bailey says that payment platforms, app developers, and payment networks are making it easier than ever for businesses of all sizes to accept contactless payments and thrive.
I admire that Apple is offering this up to third-party services instead of closing off other functionalities.
Slow POS terminals, farewell.
Late Apple Pay
Pay Apple later.
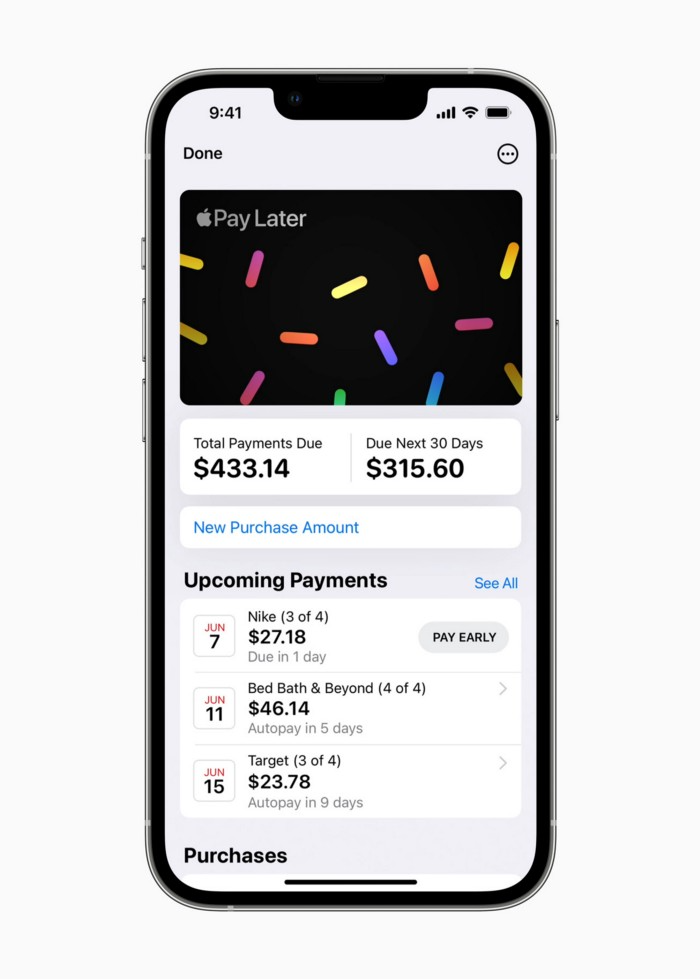
Apple Pay Later enables US consumers split Apple Pay purchases into four equal payments over six weeks with no interest or fees.
The Apple ecosystem integration makes this BNPL scheme unique. Nonstick. No dumb forms.
Frictionless.
Just double-tap the button.
Apple Pay Later was designed with users' financial well-being in mind. Apple makes it easy to use, track, and pay back Apple Pay Later from Wallet.
Apple Pay Later can be signed up in Wallet or when using Apple Pay. Apple Pay Later can be used online or in an app that takes Apple Pay and leverages the Mastercard network.
Apple Pay Order Tracking helps consumers access detailed receipts and order tracking in Wallet for Apple Pay purchases at participating stores.
Bad BNPL suppliers, goodbye.
Most bankers will be caught in Apple's eye playing mini golf in high-rise offices.
The big problem:
Banks still think about features and big numbers just like other smartphone makers did not too long ago.
Apple thinks about effortlessness, seamlessness, and frictionlessness that just work through integrated hardware and software.
Let me know what you think Apple’s next power moves in the banking industry could be.
Jason Kottke
3 years ago
Lessons on Leadership from the Dancing Guy
This is arguably the best three-minute demonstration I've ever seen of anything. Derek Sivers turns a shaky video of a lone dancing guy at a music festival into a leadership lesson.
A leader must have the courage to stand alone and appear silly. But what he's doing is so straightforward that it's almost instructive. This is critical. You must be simple to follow!
Now comes the first follower, who plays an important role: he publicly demonstrates how to follow. The leader embraces him as an equal, so it's no longer about the leader — it's about them, plural. He's inviting his friends to join him. It takes courage to be the first follower! You stand out and dare to be mocked. Being a first follower is a style of leadership that is underappreciated. The first follower elevates a lone nut to the position of leader. If the first follower is the spark that starts the fire, the leader is the flint.
This link was sent to me by @ottmark, who noted its resemblance to Kurt Vonnegut's three categories of specialists required for revolution.
The rarest of these specialists, he claims, is an actual genius – a person capable generating seemingly wonderful ideas that are not widely known. "A genius working alone is generally dismissed as a crazy," he claims.
The second type of specialist is much easier to find: a highly intellectual person in good standing in his or her community who understands and admires the genius's new ideas and can attest that the genius is not insane. "A person like him working alone can only crave loudly for changes, but fail to say what their shapes should be," Slazinger argues.
Jeff Veen reduced the three personalities to "the inventor, the investor, and the evangelist" on Twitter.
Matthew Royse
3 years ago
These 10 phrases are unprofessional at work.
Successful workers don't talk this way.

"I know it's unprofessional, but I can't stop." — Author Sandy Hall
Do you realize your unprofessionalism? Do you care? Self-awareness?
Everyone can improve their unprofessionalism. Some workplace phrases and words shouldn't be said.
People often say out loud what they're thinking. They show insecurity, incompetence, and disrespect.
"Think before you speak," goes the saying.
Some of these phrases are "okay" in certain situations, but you'll lose colleagues' respect if you use them often.
Your word choice. Your tone. Your intentions. They matter.
Choose your words carefully to build work relationships and earn peer respect. You should build positive relationships with coworkers and clients.
These 10 phrases are unprofessional.
1. That Meeting Really Sucked
Wow! Were you there? You should be responsible if you attended. You can influence every conversation.
Alternatives
Improve the meeting instead of complaining afterward. Make it more meaningful and productive.
2. Not Sure if You Saw My Last Email
Referencing a previous email irritates people. Email follow-up can be difficult. Most people get tons of emails a day, so it may have been buried, forgotten, or low priority.
Alternatives
It's okay to follow up, but be direct, short, and let the recipient "save face"
3. Any Phrase About Sex, Politics, and Religion
Discussing sex, politics, and religion at work is foolish. If you discuss these topics, you could face harassment lawsuits.
Alternatives
Keep quiet about these contentious issues. Don't touch them.
4. I Know What I’m Talking About
Adding this won't persuade others. Research, facts, and topic mastery are key to persuasion. If you're knowledgeable, you don't need to say this.
Alternatives
Please don’t say it at all. Justify your knowledge.
5. Per Our Conversation
This phrase sounds like legal language. You seem to be documenting something legally. Cold, stern, and distant. "As discussed" sounds inauthentic.
Alternatives
It was great talking with you earlier; here's what I said.
6. Curse-Word Phrases
Swearing at work is unprofessional. You never know who's listening, so be careful. A child may be at work or on a Zoom or Teams call. Workplace cursing is unacceptable.
Alternatives
Avoid adult-only words.
7. I Hope This Email Finds You Well
This is a unique way to wish someone well. This phrase isn't as sincere as the traditional one. When you talk about the email, you're impersonal.
Alternatives
Genuinely care for others.
8. I Am Really Stressed
Happy, strong, stress-managing coworkers are valued. Manage your own stress. Exercise, sleep, and eat better.
Alternatives
Everyone has stress, so manage it. Don't talk about your stress.
9. I Have Too Much to Do
You seem incompetent. People think you can't say "no" or have poor time management. If you use this phrase, you're telling others you may need to change careers.
Alternatives
Don't complain about your workload; just manage it.
10. Bad Closing Salutations
"Warmly," "best," "regards," and "warm wishes" are common email closings. This conclusion sounds impersonal. Why use "warmly" for finance's payment status?
Alternatives
Personalize the closing greeting to the message and recipient. Use "see you tomorrow" or "talk soon" as closings.
Bringing It All Together
These 10 phrases are unprofessional at work. That meeting sucked, not sure if you saw my last email, and sex, politics, and religion phrases.
Also, "I know what I'm talking about" and any curse words. Also, avoid phrases like I hope this email finds you well, I'm stressed, and I have too much to do.
Successful workers communicate positively and foster professionalism. Don't waste chances to build strong work relationships by being unprofessional.
“Unprofessionalism damages the business reputation and tarnishes the trust of society.” — Pearl Zhu, an American author
This post is a summary. Read full article here