


Which Metaverse Is Better, Decentraland or Sandbox?
The metaverse is the most commonly used term in current technology discussions. While the entire tech ecosystem awaits the metaverse's full arrival, defining it is difficult. Imagine the internet in the '80s! The metaverse is a three-dimensional virtual world where users can interact with digital solutions and each other as digital avatars.
The metaverse is a three-dimensional virtual world where users can interact with digital solutions and each other as digital avatars.
Among the metaverse hype, the Decentraland vs Sandbox debate has gained traction. Both are decentralized metaverse platforms with no central authority. So, what's the difference and which is better? Let us examine the distinctions between Decentraland and Sandbox.
2 Popular Metaverse Platforms Explained
The first step in comparing sandbox and Decentraland is to outline the definitions. Anyone keeping up with the metaverse news has heard of the two current leaders. Both have many similarities, but also many differences. Let us start with defining both platforms to see if there is a winner.
Decentraland
Decentraland, a fully immersive and engaging 3D metaverse, launched in 2017. It allows players to buy land while exploring the vast virtual universe. Decentraland offers a wide range of activities for its visitors, including games, casinos, galleries, and concerts. It is currently the longest-running metaverse project.
Decentraland began with a $24 million ICO and went public in 2020. The platform's virtual real estate parcels allow users to create a variety of experiences. MANA and LAND are two distinct tokens associated with Decentraland. MANA is the platform's native ERC-20 token, and users can burn MANA to get LAND, which is ERC-721 compliant. The MANA coin can be used to buy avatars, wearables, products, and names on Decentraland.
Sandbox
Sandbox, the next major player, began as a blockchain-based virtual world in 2011 and migrated to a 3D gaming platform in 2017. The virtual world allows users to create, play, own, and monetize their virtual experiences. Sandbox aims to empower artists, creators, and players in the blockchain community to customize the platform. Sandbox gives the ideal means for unleashing creativity in the development of the modern gaming ecosystem.
The project combines NFTs and DAOs to empower a growing community of gamers. A new play-to-earn model helps users grow as gamers and creators. The platform offers a utility token, SAND, which is required for all transactions.
What are the key points from both metaverse definitions to compare Decentraland vs sandbox?
It is ideal for individuals, businesses, and creators seeking new artistic, entertainment, and business opportunities. It is one of the rapidly growing Decentralized Autonomous Organization projects. Holders of MANA tokens also control the Decentraland domain.
Sandbox, on the other hand, is a blockchain-based virtual world that runs on the native token SAND. On the platform, users can create, sell, and buy digital assets and experiences, enabling blockchain-based gaming. Sandbox focuses on user-generated content and building an ecosystem of developers.
Sandbox vs. Decentraland
If you try to find what is better Sandbox or Decentraland, then you might struggle with only the basic definitions. Both are metaverse platforms offering immersive 3D experiences. Users can freely create, buy, sell, and trade digital assets. However, both have significant differences, especially in MANA vs SAND.
For starters, MANA has a market cap of $5,736,097,349 versus $4,528,715,461, giving Decentraland an advantage.
The MANA vs SAND pricing comparison is also noteworthy. A SAND is currently worth $3664, while a MANA is worth $2452.
The value of the native tokens and the market capitalization of the two metaverse platforms are not enough to make a choice. Let us compare Sandbox vs Decentraland based on the following factors.
Workstyle
The way Decentraland and Sandbox work is one of the main comparisons. From a distance, they both appear to work the same way. But there's a lot more to learn about both platforms' workings. Decentraland has 90,601 digital parcels of land.
Individual parcels of virtual real estate or estates with multiple parcels of land are assembled. It also has districts with similar themes and plazas, which are non-tradeable parcels owned by the community. It has three token types: MANA, LAND, and WEAR.
Sandbox has 166,464 plots of virtual land that can be grouped into estates. Estates are owned by one person, while districts are owned by two or more people. The Sandbox metaverse has four token types: SAND, GAMES, LAND, and ASSETS.
Age
The maturity of metaverse projects is also a factor in the debate. Decentraland is clearly the winner in terms of maturity. It was the first solution to create a 3D blockchain metaverse. Decentraland made the first working proof of concept public. However, Sandbox has only made an Alpha version available to the public.
Backing
The MANA vs SAND comparison would also include support for both platforms. Digital Currency Group, FBG Capital, and CoinFund are all supporters of Decentraland. It has also partnered with Polygon, the South Korean government, Cyberpunk, and Samsung.
SoftBank, a Japanese multinational conglomerate focused on investment management, is another major backer. Sandbox has the backing of one of the world's largest investment firms, as well as Slack and Uber.
Compatibility
Wallet compatibility is an important factor in comparing the two metaverse platforms. Decentraland currently has a competitive advantage. How? Both projects' marketplaces accept ERC-20 wallets. However, Decentraland has recently improved by bridging with Walletconnect. So it can let Polygon users join Decentraland.
Scalability
Because Sandbox and Decentraland use the Ethereum blockchain, scalability is an issue. Both platforms' scalability is constrained by volatile tokens and high gas fees. So, scalability issues can hinder large-scale adoption of both metaverse platforms.
Buying Land
Decentraland vs Sandbox comparisons often include virtual real estate. However, the ability to buy virtual land on both platforms defines the user experience and differentiates them. In this case, Sandbox offers better options for users to buy virtual land by combining OpenSea and Sandbox. In fact, Decentraland users can only buy from the MANA marketplace.
Innovation
The rate of development distinguishes Sandbox and Decentraland. Both platforms have been developing rapidly new features. However, Sandbox wins by adopting Polygon NFT layer 2 solutions, which consume almost 100 times less energy than Ethereum.
Collaborations
The platforms' collaborations are the key to determining "which is better Sandbox or Decentraland." Adoption of metaverse platforms like the two in question can be boosted by association with reputable brands. Among the partners are Atari, Cyberpunk, and Polygon. Rather, Sandbox has partnered with well-known brands like OpenSea, CryptoKitties, The Walking Dead, Snoop Dogg, and others.
Platform Adaptivity
Another key feature that distinguishes Sandbox and Decentraland is the ease of use. Sandbox clearly wins in terms of platform access. It allows easy access via social media, email, or a Metamask wallet. However, Decentraland requires a wallet connection.
Prospects
The future development plans also play a big role in defining Sandbox vs Decentraland. Sandbox's future development plans include bringing the platform to mobile devices. This includes consoles like PlayStation and Xbox. By the end of 2023, the platform expects to have around 5000 games.
Decentraland, on the other hand, has no set plan. In fact, the team defines the decisions that appear to have value. They plan to add celebrities, creators, and brands soon, along with NFT ads and drops.
Final Words
The comparison of Decentraland vs Sandbox provides a balanced view of both platforms. You can see how difficult it is to determine which decentralized metaverse is better now. Sandbox is still in Alpha, whereas Decentraland has a working proof of concept.
Sandbox, on the other hand, has better graphics and is backed by some big names. But both have a long way to go in the larger decentralized metaverse.
More on Web3 & Crypto

Sam Hickmann
3 years ago
Nomad.xyz got exploited for $190M
Key Takeaways:
Another hack. This time was different. This is a doozy.
Why? Nomad got exploited for $190m. It was crypto's 5th-biggest hack. Ouch.
It wasn't hackers, but random folks. What happened:
A Nomad smart contract flaw was discovered. They couldn't drain the funds at once, so they tried numerous transactions. Rookie!
People noticed and copied the attack.
They just needed to discover a working transaction, substitute the other person's address with theirs, and run it.

In a two-and-a-half-hour attack, $190M was siphoned from Nomad Bridge.
Nomad is a novel approach to blockchain interoperability that leverages an optimistic mechanism to increase the security of cross-chain communication. — nomad.xyz
This hack was permissionless, therefore anyone could participate.
After the fatal blow, people fought over the scraps.
Cross-chain bridges remain a DeFi weakness and exploit target. When they collapse, it's typically total.
$190M...gobbled.
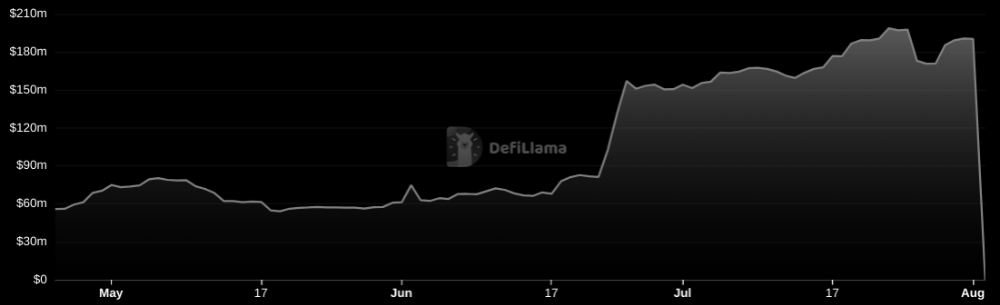
Unbacked assets are hurting Nomad-dependent chains. Moonbeam, EVMOS, and Milkomeda's TVLs dropped.
This incident is every-man-for-himself, although numerous whitehats exploited the issue...
But what triggered the feeding frenzy?
How did so many pick the bones?
After a normal upgrade in June, the bridge's Replica contract was initialized with a severe security issue. The 0x00 address was a trusted root, therefore all messages were valid by default.
After a botched first attempt (costing $350k in gas), the original attacker's exploit tx called process() without first 'proving' its validity.
The process() function executes all cross-chain messages and checks the merkle root of all messages (line 185).
The upgrade caused transactions with a'messages' value of 0 (invalid, according to old logic) to be read by default as 0x00, a trusted root, passing validation as 'proven'
Any process() calls were valid. In reality, a more sophisticated exploiter may have designed a contract to drain the whole bridge.
Copycat attackers simply copied/pasted the same process() function call using Etherscan, substituting their address.
The incident was a wild combination of crowdhacking, whitehat activities, and MEV-bot (Maximal Extractable Value) mayhem.
For example, 🍉🍉🍉. eth stole $4M from the bridge, but claims to be whitehat.

Others stood out for the wrong reasons. Repeat criminal Rari Capital (Artibrum) exploited over $3M in stablecoins, which moved to Tornado Cash.
The top three exploiters (with 95M between them) are:
$47M: 0x56D8B635A7C88Fd1104D23d632AF40c1C3Aac4e3
$40M: 0xBF293D5138a2a1BA407B43672643434C43827179
$8M: 0xB5C55f76f90Cc528B2609109Ca14d8d84593590E
Here's a list of all the exploiters:
The project conducted a Quantstamp audit in June; QSP-19 foreshadowed a similar problem.
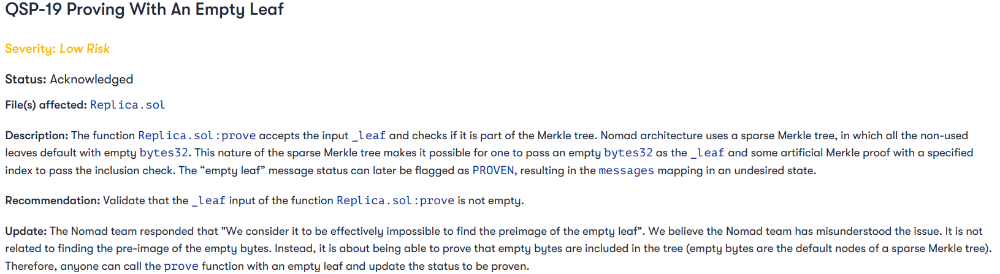
The auditor's comments that "We feel the Nomad team misinterpreted the issue" speak to a troubling attitude towards security that the project's "Long-Term Security" plan appears to confirm:
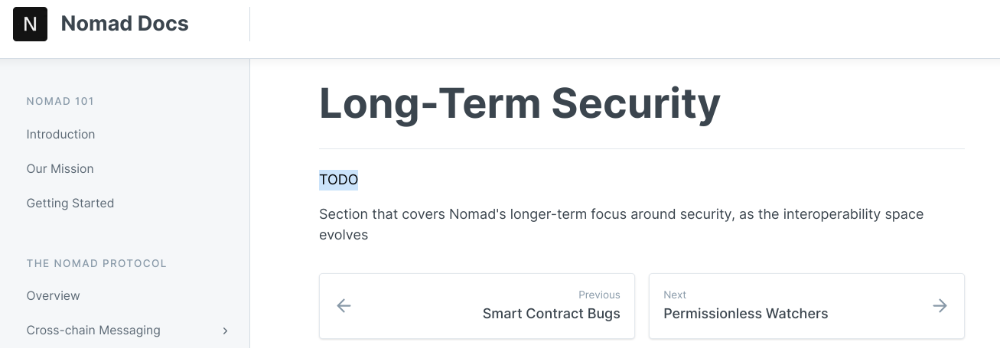
Concerns were raised about the team's response time to a live, public exploit; the team's official acknowledgement came three hours later.
"Removing the Replica contract as owner" stopped the exploit, but it was too late to preserve the cash.
Closed blockchain systems are only as strong as their weakest link.
The Harmony network is in turmoil after its bridge was attacked and lost $100M in late June.
What's next for Nomad's ecosystems?
Moonbeam's TVL is now $135M, EVMOS's is $3M, and Milkomeda's is $20M.
Loss of confidence may do more damage than $190M.
Cross-chain infrastructure is difficult to secure in a new, experimental sector. Bridge attacks can pollute an entire ecosystem or more.
Nomadic liquidity has no permanent home, so consumers will always migrate in pursuit of the "next big thing" and get stung when attentiveness wanes.
DeFi still has easy prey...
Sources: rekt.news & The Milk Road.

CoinTelegraph
4 years ago
2 NFT-based blockchain games that could soar in 2022
NFTs look ready to rule 2022, and the recent pivot toward NFT utility in P2E gaming could make blockchain gaming this year’s sector darling.
After the popularity of decentralized finance (DeFi) came the rise of nonfungible tokens (NFTs), and to the surprise of many, NFTs took the spotlight and now remain front and center with the highest volume in sales occurring at the start of January 2022.
While 2021 became the year of NFTs, GameFi applications did surpass DeFi in terms of user popularity. According to data from DappRadar, Bloomberg gathered:
Nearly 50% of active cryptocurrency wallets connected to decentralized applications in November were for playing games. The percentage of wallets linked to decentralized finance, or DeFi, dapps fell to 45% during the same period, after months of being the leading dapp use case.
Blockchain play-to-earn (P2E) game Axie infinity skyrocketed and kicked off a gaming craze that is expected to continue all throughout 2022. Crypto pundits and gaming advocates have high expectations for P2E blockchain-based games and there’s bound to be a few sleeping giants that will dominate the sector.
Let’s take a look at five blockchain games that could make waves in 2022.
DeFi Kingdoms
The inspiration for DeFi Kingdoms came from simple beginnings — a passion for investing that lured the developers to blockchain technology. DeFi Kingdoms was born as a visualization of liquidity pool investing where in-game ‘gardens’ represent literal and figurative token pairings and liquidity pool mining.
As shown in the game, investors have a portion of their LP share within a plot filled with blooming plants. By attaching the concept of growth to DeFi protocols within a play-and-earn model, DeFi Kingdoms puts a twist on “playing” a game.
Built on the Harmony Network, DeFi Kingdoms became the first project on the network to ever top the DappRadar charts. This could be attributed to an influx of individuals interested in both DeFi and blockchain games or it could be attributed to its recent in-game utility token JEWEL surging.
JEWEL is a utility token that allows users to purchase NFTs in-game buffs to increase a base-level stat. It is also used for liquidity mining to grant users the opportunity to make more JEWEL through staking.
JEWEL is also a governance token that gives holders a vote in the growth and evolution of the project. In the past four months, the token price surged from $1.23 to an all-time high of $22.52. At the time of writing, JEWEL is down by nearly 16%, trading at $19.51.
Surging approximately 1,487% from its humble start of $1.23 four months ago in September, JEWEL token price has increased roughly 165% this last month alone, according to data from CoinGecko.
Guild of Guardians
Guild of Guardians is one of the more anticipated blockchain games in 2022 and it is built on ImmutableX, the first layer-two solution built on Ethereum that focuses on NFTs. Aiming to provide more access, it will operate as a free-to-play mobile role-playing game, modeling the P2E mechanics.
Similar to blockchain games like Axie Infinity, Guild of Guardians in-game assets can be exchanged. The project seems to be of interest to many gamers and investors with its NFT founder sale and token launch generating nearly $10 million in volume.
Launching its in-game token in October of 2021, the Guild of Guardians (GOG) tokens are ERC-20 tokens known as ‘gems’ inside the game. Gems are what power key features in the game such as minting in-game NFTs and interacting with the marketplace, and are available to earn while playing.
For the last month, the Guild of Guardians token has performed rather steadily after spiking to its all-time high of $2.81 after its launch. Despite the token being down over 50% from its all-time high, at the time of writing, some members of the community are looking forward to the possibility of staking and liquidity pools, which are features that tend to help stabilize token prices.

Protos
3 years ago
StableGains lost $42M in Anchor Protocol.
StableGains lost millions of dollars in customer funds in Anchor Protocol without telling its users. The Anchor Protocol offered depositors 19-20% APY before its parent ecosystem, Terra LUNA, lost tens of billions of dollars in market capitalization as LUNA fell below $0.01 and its stablecoin (UST) collapsed.
A Terra Research Forum member raised the alarm. StableGains changed its homepage and Terms and Conditions to reflect how it mitigates risk, a tacit admission that it should have done so from the start.
StableGains raised $600,000 in YCombinator's W22 batch. Moonfire, Broom Ventures, and Goodwater Capital invested $3 million more.
StableGains' 15% yield product attracted $42 million in deposits. StableGains kept most of its deposits in Anchor's UST pool earning 19-20% APY, kept one-quarter of the interest as a management fee, and then gave customers their promised 15% APY. It lost almost all customer funds when UST melted down. It changed withdrawal times, hurting customers.
- StableGains said de-pegging was unlikely. According to its website, 1 UST can be bought and sold for $1 of LUNA. LUNA became worthless, and Terra shut down its blockchain.
- It promised to diversify assets across several stablecoins to reduce the risk of one losing its $1 peg, but instead kept almost all of them in one basket.
- StableGains promised withdrawals in three business days, even if a stablecoin needed time to regain its peg. StableGains uses Coinbase for deposits and withdrawals, and customers receive the exact amount of USDC requested.
StableGains scrubs its website squeaky clean
StableGains later edited its website to say it only uses the "most trusted and tested stablecoins" and extended withdrawal times from three days to indefinite time "in extreme cases."
Previously, USDC, TerraUST (UST), and Dai were used (DAI). StableGains changed UST-related website content after the meltdown. It also removed most references to DAI.
Customers noticed a new clause in the Terms and Conditions denying StableGains liability for withdrawal losses. This new clause would have required customers to agree not to sue before withdrawing funds, avoiding a class-action lawsuit.
Customers must sign a waiver to receive a refund.
Erickson Kramer & Osborne law firm has asked StableGains to preserve all internal documents on customer accounts, marketing, and TerraUSD communications. The firm has not yet filed a lawsuit.
Thousands of StableGains customers lost an estimated $42 million.
Celsius Network customers also affected
CEL used Terra LUNA's Anchor Protocol. Celsius users lost money in the crypto market crash and UST meltdown. Many held CEL and LUNA as yielding deposits.
CEO Alex Mashinsky accused "unknown malefactors" of targeting Celsius Network without evidence. Celsius has not publicly investigated this claim as of this article's publication.
CEL fell before UST de-pegged. On June 2, 2021, it reached $8.01. May 19's close: $0.82.
When some Celsius Network users threatened to leave over token losses, Mashinsky replied, "Leave if you don't think I'm sincere and working harder than you, seven days a week."
Celsius Network withdrew $500 million from Anchor Protocol, but smaller holders had trouble.
Read original article here
You might also like

Joe Procopio
3 years ago
Provide a product roadmap that can withstand startup velocities
This is how to build a car while driving.
Building a high-growth startup is compared to building a car while it's speeding down the highway.
How to plan without going crazy? Or, without losing team, board, and investor buy-in?
I just delivered our company's product roadmap for the rest of the year. Complete. Thorough. Page-long. I'm optimistic about its chances of surviving as everything around us changes, from internal priorities to the global economy.
It's tricky. This isn't the first time I've created a startup roadmap. I didn't invent a document. It took time to deliver a document that will be relevant for months.
Goals matter.
Although they never change, goals are rarely understood.
This is the third in a series about a startup's unique roadmapping needs. Velocity is the intensity at which a startup must produce to survive.
A high-growth startup moves at breakneck speed, which I alluded to when I said priorities and economic factors can change daily or weekly.
At that speed, a startup's roadmap must be flexible, bend but not break, and be brief and to the point. I can't tell you how many startups and large companies develop a product roadmap every quarter and then tuck it away.
Big, wealthy companies can do this. It's suicide for a startup.
The drawer thing happens because startup product roadmaps are often valid for a short time. The roadmap is a random list of features prioritized by different company factions and unrelated to company goals.
It's not because the goals changed that a roadmap is shelved or ignored. Because the company's goals were never communicated or documented in the context of its product.
In the previous post, I discussed how to turn company goals into a product roadmap. In this post, I'll show you how to make a one-page startup roadmap.
In a future post, I'll show you how to follow this roadmap. This roadmap helps you track company goals, something a roadmap must do.
Be vague for growth, but direct for execution.
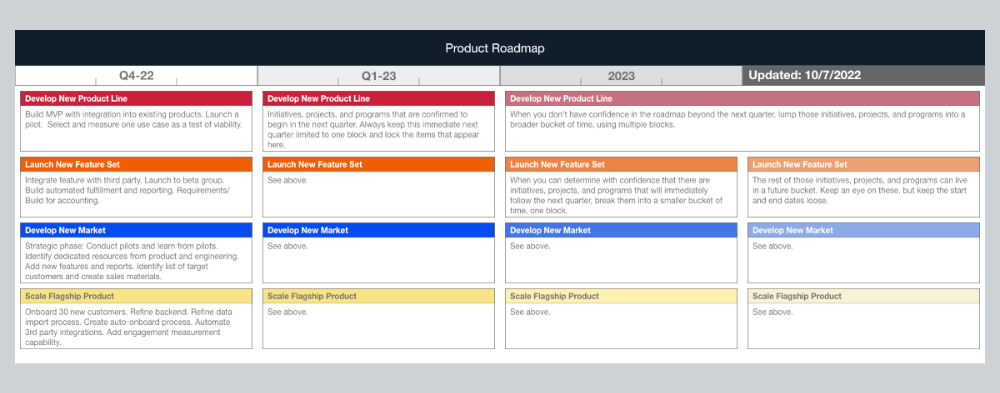
Here's my plan. The real one has more entries and more content in each.
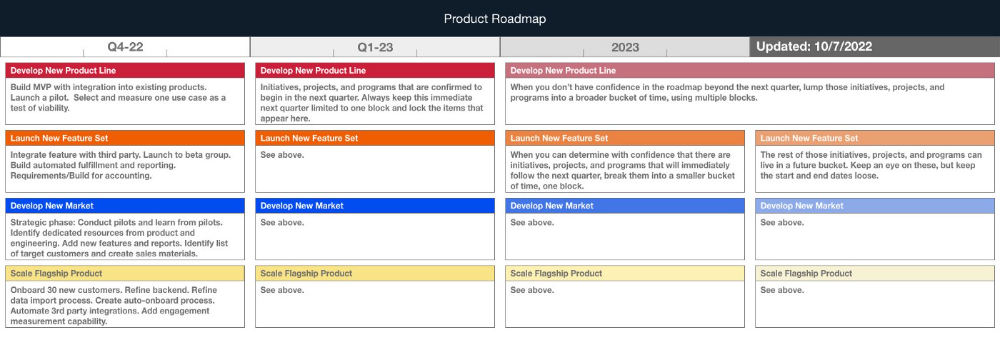
Let's discuss smaller boxes.
Product developers and engineers know that the further out they predict, the more wrong they'll be. When developing the product roadmap, this rule is ignored. Then it bites us three, six, or nine months later when we haven't even started.
Why do we put everything in a product roadmap like a project plan?
Yes, I know. We use it when the product roadmap isn't goal-based.
A goal-based roadmap begins with a document that outlines each goal's idea, execution, growth, and refinement.
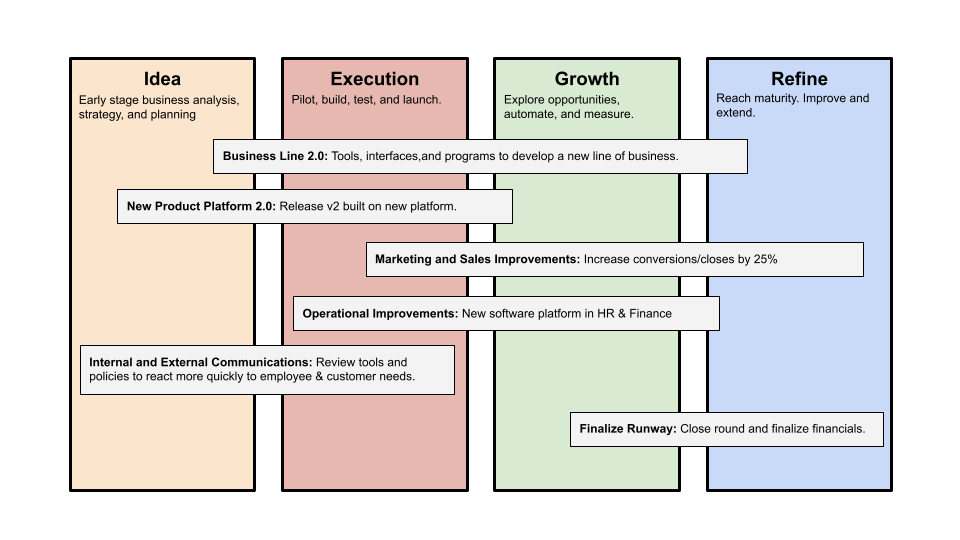
Once the goals are broken down into epics, initiatives, projects, and programs, only the idea and execution phases should be modeled. Any goal growth or refinement items should be vague and loosely mapped.
Why? First, any idea or execution-phase goal will result in growth initiatives that are unimaginable today. Second, internal priorities and external factors will change, but the goals won't. Locking items into calendar slots reduces flexibility and forces deviation from the single source of truth.
No soothsayers. Predicting the future is pointless; just prepare.
A map is useless if you don't know where you're going.
As we speed down the road, the car and the road will change. Goals define the destination.
This quarter and next quarter's roadmap should be set. After that, you should track destination milestones, not how to get there.
When you do that, even the most critical investors will understand the roadmap and buy in. When you track progress at the end of the quarter and revise your roadmap, the destination won't change.

Stephen Moore
3 years ago
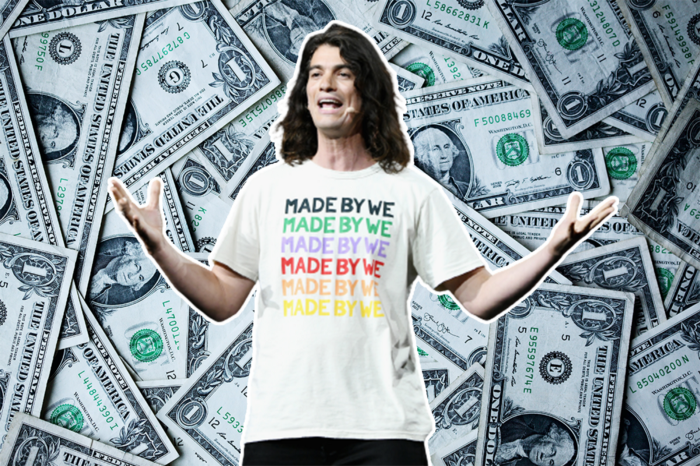
Adam Neumanns is working to create the future of living in a classic example of a guy failing upward.
The comeback tour continues…
First, he founded a $47 billion co-working company (sorry, a “tech company”).
He established WeLive to disrupt apartment life.
Then he created WeGrow, a school that tossed aside the usual curriculum to feed children's souls and release their potential.
He raised the world’s consciousness.
Then he blew it all up (without raising the world’s consciousness). (He bought a wave pool.)
Adam Neumann's WeWork business burned investors' money. The founder sailed off with unimaginable riches, leaving long-time employees with worthless stocks and the company bleeding money. His track record, which includes a failing baby clothing company, should have stopped investors cold.
Once the dust settled, folks went on. We forgot about the Neumanns! We forgot about the private jets, company retreats, many houses, and WeWork's crippling. In that moment, the prodigal son of entrepreneurship returned, choosing the blockchain as his industry. His homecoming tour began with Flowcarbon, which sold Goddess Nature Tokens to lessen companies' carbon footprints.
Did it work?
Of course not.
Despite receiving $70 million from Andreessen Horowitz's a16z, the project has been halted just two months after its announcement.
This triumph should lower his grade.
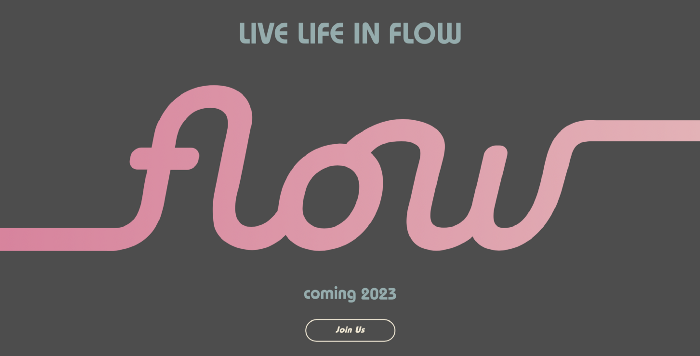
Neumann seems to have moved on and has another revolutionary idea for the future of living. Flow (not Flowcarbon) aims to help people live in flow and will launch in 2023. It's the classic Neumann pitch: lofty goals, yogababble, and charisma to attract investors.
It's a winning formula for one investment fund. a16z has backed the project with its largest single check, $350 million. It has a splash page and 3,000 rental units, but is valued at over $1 billion. The blog post praised Neumann for reimagining the office and leading a paradigm-shifting global company.
Flow's mission is to solve the nation's housing crisis. How? Idk. It involves offering community-centric services in apartment properties to the same remote workforce he once wooed with free beer and a pingpong table. Revolutionary! It seems the goal is to apply WeWork's goals of transforming physical spaces and building community to apartments to solve many of today's housing problems.
The elevator pitch probably sounded great.
At least a16z knows it's a near-impossible task, calling it a seismic shift. Marc Andreessen opposes affordable housing in his wealthy Silicon Valley town. As details of the project emerge, more investors will likely throw ethics and morals out the window to go with the flow, throwing money at a man known for burning through it while building toxic companies, hoping he can bank another fantasy valuation before it all crashes.
Insanity is repeating the same action and expecting a different result. Everyone on the Neumann hype train needs to sober up.
Like WeWork, this venture Won’tWork.
Like before, it'll cause a shitstorm.

MartinEdic
3 years ago
Russia Through the Windows: It's Very Bad
And why we must keep arming Ukraine
Russian expatriates write about horrific news from home.
Read this from Nadin Brzezinski. She's not a native English speaker, so there are grammar errors, but her tale smells true.
Terrible truth.
There's much more that reveals Russia's grim reality.
Non-leadership. Millions of missing supplies are presumably sold for profit, leaving untrained troops without food or gear. Missile attacks pause because they run out. Fake schemes to hold talks as a way of stalling while they scramble for solutions.
Street men were mobilized. Millions will be ground up to please a crazed despot. Fear, wrath, and hunger pull apart civilization.
It's the most dystopian story, but Ukraine is worse. Destruction of a society, country, and civilization. Only the invaders' corruption and incompetence save the Ukrainians.
Rochester, NY. My suburb had many Soviet-era Ukrainian refugees. Their kids were my classmates. Fifty years later, many are still my friends. I loved their food and culture. My town has 20,000 Ukrainians.
Grieving but determined. They don't quit. They won't quit. Russians are eternal enemies.
It's the Russian people's willingness to tolerate corruption, abuse, and stupidity by their leaders. They are paying. 65000 dead. Ruined economy. No freedom to speak. Americans do not appreciate that freedom as we should.
It lets me write/publish.
Russian friends are shocked. Many are here because their parents escaped Russian anti-semitism and authoritarian oppression. A Russian cultural legacy says a strongman's methods are admirable.
A legacy of a slavery history disguised as serfdom. Peasants and Princes.
Read Tolstoy. Then Anna Karenina. The main characters are princes and counts, whose leaders are incompetent idiots with wealth and power.
Peasants who die in their wars due to incompetence are nameless ciphers.
Sound familiar?