


Framework to Evaluate Metaverse and Web3
Everywhere we turn, there's a new metaverse or Web3 debut. Microsoft recently announced a $68.7 BILLION cash purchase of Activision.
Like AI in 2013 and blockchain in 2014, NFT growth in 2021 feels like this year's metaverse and Web3 growth. We are all bombarded with information, conflicting signals, and a sensation of FOMO.
How can we evaluate the metaverse and Web3 in a noisy, new world? My framework for evaluating upcoming technologies and themes is shown below. I hope you will also find them helpful.
Understand the “pipes” in a new space.
Whatever people say, Metaverse and Web3 will have to coexist with the current Internet. Companies who host, move, and store data over the Internet have a lot of intriguing use cases in Metaverse and Web3, whether in infrastructure, data analytics, or compliance. Hence the following point.
## Understand the apps layer and their infrastructure.
Gaming, crypto exchanges, and NFT marketplaces would not exist today if not for technology that enables rapid app creation. Yes, according to Chainalysis and other research, 30–40% of Ethereum is self-hosted, with the rest hosted by large cloud providers. For Microsoft to acquire Activision makes strategic sense. It's not only about the games, but also the infrastructure that supports them.
Follow the money
Understanding how money and wealth flow in a complex and dynamic environment helps build clarity. Unless you are exceedingly wealthy, you have limited ability to significantly engage in the Web3 economy today. Few can just buy 10 ETH and spend it in one day. You must comprehend who benefits from the process, and how that 10 ETH circulates now and possibly tomorrow. Major holders and players control supply and liquidity in any market. Today, most Web3 apps are designed to increase capital inflow so existing significant holders can utilize it to create a nascent Web3 economy. When you see a new Metaverse or Web3 application, remember how money flows.
What is the use case?
What does the app do? If there is no clear use case with clear makers and consumers solving a real problem, then the euphoria soon fades, and the only stakeholders who remain enthused are those who have too much to lose.
Time is a major competition that is often overlooked.
We're only busier, but each day is still 24 hours. Using new apps may mean that time is lost doing other things. The user must be eager to learn. Metaverse and Web3 vs. our time? I don't think we know the answer yet (at least for working adults whose cost of time is higher).
I don't think we know the answer yet (at least for working adults whose cost of time is higher).
People and organizations need security and transparency.
For new technologies or apps to be widely used, they must be safe, transparent, and trustworthy. What does secure Metaverse and Web3 mean? This is an intriguing subject for both the business and public sectors. Cloud adoption grew in part due to improved security and data protection regulations.
The following frameworks can help analyze and understand new technologies and emerging technological topics, unless you are a significant investment fund with the financial ability to gamble on numerous initiatives and essentially form your own “index fund”.
I write on VC, startups, and leadership.
More on https://www.linkedin.com/in/joycejshen/ and https://joyceshen.substack.com/
This writing is my own opinion and does not represent investment advice.
More on Web3 & Crypto

Vivek Singh
4 years ago
A Warm Welcome to Web3 and the Future of the Internet
Let's take a look back at the internet's history and see where we're going — and why.
Tim Berners Lee had a problem. He was at CERN, the world's largest particle physics factory, at the time. The institute's stated goal was to study the simplest particles with the most sophisticated scientific instruments. The institute completed the LEP Tunnel in 1988, a 27 kilometer ring. This was Europe's largest civil engineering project (to study smaller particles — electrons).
The problem Tim Berners Lee found was information loss, not particle physics. CERN employed a thousand people in 1989. Due to team size and complexity, people often struggled to recall past project information. While these obstacles could be overcome, high turnover was nearly impossible. Berners Lee addressed the issue in a proposal titled ‘Information Management'.
When a typical stay is two years, data is constantly lost. The introduction of new people takes a lot of time from them and others before they understand what is going on. An emergency situation may require a detective investigation to recover technical details of past projects. Often, the data is recorded but cannot be found. — Information Management: A Proposal
He had an idea. Create an information management system that allowed users to access data in a decentralized manner using a new technology called ‘hypertext'.
To quote Berners Lee, his proposal was “vague but exciting...”. The paper eventually evolved into the internet we know today. Here are three popular W3C standards used by billions of people today:
(credit: CERN)
HTML (Hypertext Markup)
A web formatting language.
URI (Unique Resource Identifier)
Each web resource has its own “address”. Known as ‘a URL'.
HTTP (Hypertext Transfer Protocol)
Retrieves linked resources from across the web.
These technologies underpin all computer work. They were the seeds of our quest to reorganize information, a task as fruitful as particle physics.
Tim Berners-Lee would probably think the three decades from 1989 to 2018 were eventful. He'd be amazed by the billions, the inspiring, the novel. Unlocking innovation at CERN through ‘Information Management'.
The fictional character would probably need a drink, walk, and a few deep breaths to fully grasp the internet's impact. He'd be surprised to see a few big names in the mix.
Then he'd say, "Something's wrong here."
We should review the web's history before going there. Was it a success after Berners Lee made it public? Web1 and Web2: What is it about what we are doing now that so many believe we need a new one, web3?
Per Outlier Ventures' Jamie Burke:
Web 1.0 was read-only.
Web 2.0 was the writable
Web 3.0 is a direct-write web.
Let's explore.
Web1: The Read-Only Web
Web1 was the digital age. We put our books, research, and lives ‘online'. The web made information retrieval easier than any filing cabinet ever. Massive amounts of data were stored online. Encyclopedias, medical records, and entire libraries were put away into floppy disks and hard drives.
In 2015, the web had around 305,500,000,000 pages of content (280 million copies of Atlas Shrugged).
Initially, one didn't expect to contribute much to this database. Web1 was an online version of the real world, but not yet a new way of using the invention.
One gets the impression that the web has been underutilized by historians if all we can say about it is that it has become a giant global fax machine. — Daniel Cohen, The Web's Second Decade (2004)
That doesn't mean developers weren't building. The web was being advanced by great minds. Web2 was born as technology advanced.
Web2: Read-Write Web
Remember when you clicked something on a website and the whole page refreshed? Is it too early to call the mid-2000s ‘the good old days'?
Browsers improved gradually, then suddenly. AJAX calls augmented CGI scripts, and applications began sending data back and forth without disrupting the entire web page. One button to ‘digg' a post (see below). Web experiences blossomed.
In 2006, Digg was the most active ‘Web 2.0' site. (Photo: Ethereum Foundation Taylor Gerring)
Interaction was the focus of new applications. Posting, upvoting, hearting, pinning, tweeting, liking, commenting, and clapping became a lexicon of their own. It exploded in 2004. Easy ways to ‘write' on the internet grew, and continue to grow.
Facebook became a Web2 icon, where users created trillions of rows of data. Google and Amazon moved from Web1 to Web2 by better understanding users and building products and services that met their needs.
Business models based on Software-as-a-Service and then managing consumer data within them for a fee have exploded.
Web2 Emerging Issues
Unbelievably, an intriguing dilemma arose. When creating this read-write web, a non-trivial question skirted underneath the covers. Who owns it all?
You have no control over [Web 2] online SaaS. People didn't realize this because SaaS was so new. People have realized this is the real issue in recent years.
Even if these organizations have good intentions, their incentive is not on the users' side.
“You are not their customer, therefore you are their product,” they say. With Laura Shin, Vitalik Buterin, Unchained
A good plot line emerges. Many amazing, world-changing software products quietly lost users' data control.
For example: Facebook owns much of your social graph data. Even if you hate Facebook, you can't leave without giving up that data. There is no ‘export' or ‘exit'. The platform owns ownership.
While many companies can pull data on you, you cannot do so.
On the surface, this isn't an issue. These companies use my data better than I do! A complex group of stakeholders, each with their own goals. One is maximizing shareholder value for public companies. Tim Berners-Lee (and others) dislike the incentives created.
“Show me the incentive and I will show you the outcome.” — Berkshire Hathaway's CEO
It's easy to see what the read-write web has allowed in retrospect. We've been given the keys to create content instead of just consume it. On Facebook and Twitter, anyone with a laptop and internet can participate. But the engagement isn't ours. Platforms own themselves.
Web3: The ‘Unmediated’ Read-Write Web
Tim Berners Lee proposed a decade ago that ‘linked data' could solve the internet's data problem.
However, until recently, the same principles that allowed the Web of documents to thrive were not applied to data...
The Web of Data also allows for new domain-specific applications. Unlike Web 2.0 mashups, Linked Data applications work with an unbound global data space. As new data sources appear on the Web, they can provide more complete answers.
At around the same time as linked data research began, Satoshi Nakamoto created Bitcoin. After ten years, it appears that Berners Lee's ideas ‘link' spiritually with cryptocurrencies.
What should Web 3 do?
Here are some quick predictions for the web's future.
Users' data:
Users own information and provide it to corporations, businesses, or services that will benefit them.
Defying censorship:
No government, company, or institution should control your access to information (1, 2, 3)
Connect users and platforms:
Create symbiotic rather than competitive relationships between users and platform creators.
Open networks:
“First, the cryptonetwork-participant contract is enforced in open source code. Their voices and exits are used to keep them in check.” Dixon, Chris (4)
Global interactivity:
Transacting value, information, or assets with anyone with internet access, anywhere, at low cost
Self-determination:
Giving you the ability to own, see, and understand your entire digital identity.
Not pull, push:
‘Push' your data to trusted sources instead of ‘pulling' it from others.
Where Does This Leave Us?
Change incentives, change the world. Nick Babalola
People believe web3 can help build a better, fairer system. This is not the same as equal pay or outcomes, but more equal opportunity.
It should be noted that some of these advantages have been discussed previously. Will the changes work? Will they make a difference? These unanswered questions are technical, economic, political, and philosophical. Unintended consequences are likely.
We hope Web3 is a more democratic web. And we think incentives help the user. If there’s one thing that’s on our side, it’s that open has always beaten closed, given a long enough timescale.
We are at the start.

The Verge
4 years ago
Bored Ape Yacht Club creator raises $450 million at a $4 billion valuation.
Yuga Labs, owner of three of the biggest NFT brands on the market, announced today a $450 million funding round. The money will be used to create a media empire based on NFTs, starting with games and a metaverse project.
The team's Otherside metaverse project is an MMORPG meant to connect the larger NFT universe. They want to create “an interoperable world” that is “gamified” and “completely decentralized,” says Wylie Aronow, aka Gordon Goner, co-founder of Bored Ape Yacht Club. “We think the real Ready Player One experience will be player run.”
Just a few weeks ago, Yuga Labs announced the acquisition of CryptoPunks and Meebits from Larva Labs. The deal brought together three of the most valuable NFT collections, giving Yuga Labs more IP to work with when developing games and metaverses. Last week, ApeCoin was launched as a cryptocurrency that will be governed independently and used in Yuga Labs properties.
Otherside will be developed by “a few different game studios,” says Yuga Labs CEO Nicole Muniz. The company plans to create development tools that allow NFTs from other projects to work inside their world. “We're welcoming everyone into a walled garden.”
However, Yuga Labs believes that other companies are approaching metaverse projects incorrectly, allowing the startup to stand out. People won't bond spending time in a virtual space with nothing going on, says Yuga Labs co-founder Greg Solano, aka Gargamel. Instead, he says, people bond when forced to work together.
In order to avoid getting smacked, Solano advises making friends. “We don't think a Zoom chat and walking around saying ‘hi' creates a deep social experience.” Yuga Labs refused to provide a release date for Otherside. Later this year, a play-to-win game is planned.
The funding round was led by Andreessen Horowitz, a major investor in the Web3 space. It previously backed OpenSea and Coinbase. Animoca Brands, Coinbase, and MoonPay are among those who have invested. Andreessen Horowitz general partner Chris Lyons will join Yuga Labs' board. The Financial Times broke the story last month.
"META IS A DOMINANT DIGITAL EXPERIENCE PROVIDER IN A DYSTOPIAN FUTURE."
This emerging [Web3] ecosystem is important to me, as it is to companies like Meta,” Chris Dixon, head of Andreessen Horowitz's crypto arm, tells The Verge. “In a dystopian future, Meta is the dominant digital experience provider, and it controls all the money and power.” (Andreessen Horowitz co-founder Marc Andreessen sits on Meta's board and invested early in Facebook.)
Yuga Labs has been profitable so far. According to a leaked pitch deck, the company made $137 million last year, primarily from its NFT brands, with a 95% profit margin. (Yuga Labs declined to comment on deck figures.)
But the company has built little so far. According to OpenSea data, it has only released one game for a limited time. That means Yuga Labs gets hundreds of millions of dollars to build a gaming company from scratch, based on a hugely lucrative art project.
Investors fund Yuga Labs based on its success. That's what they did, says Dixon, “they created a culture phenomenon”. But ultimately, the company is betting on the same thing that so many others are: that a metaverse project will be the next big thing. Now they must construct it.

Alex Bentley
4 years ago
Why Bill Gates thinks Bitcoin, crypto, and NFTs are foolish
Microsoft co-founder Bill Gates assesses digital assets while the bull is caged.

Bill Gates is well-respected.
Reasonably. He co-founded and led Microsoft during its 1980s and 1990s revolution.
After leaving Microsoft, Bill Gates pursued other interests. He and his wife founded one of the world's largest philanthropic organizations, Bill & Melinda Gates Foundation. He also supports immunizations, population control, and other global health programs.
When Gates criticized Bitcoin, cryptocurrencies, and NFTs, it made news.
Bill Gates said at the 58th Munich Security Conference...
“You have an asset class that’s 100% based on some sort of greater fool theory that somebody’s going to pay more for it than I do.”
Gates means digital assets. Like many bitcoin critics, he says digital coins and tokens are speculative.
And he's not alone. Financial experts have dubbed Bitcoin and other digital assets a "bubble" for a decade.
Gates also made fun of Bored Ape Yacht Club and NFTs, saying, "Obviously pricey digital photographs of monkeys will help the world."
Why does Bill Gates dislike digital assets?
According to Gates' latest comments, Bitcoin, cryptos, and NFTs aren't good ways to hold value.
Bill Gates is a better investor than Elon Musk.
“I’m used to asset classes, like a farm where they have output, or like a company where they make products,” Gates said.
The Guardian claimed in April 2021 that Bill and Melinda Gates owned the most U.S. farms. Over 242,000 acres of farmland.
The Gates couple has enough farmland to cover Hong Kong.

Bill Gates is a classic investor. He wants companies with an excellent track record, strong fundamentals, and good management. Or tangible assets like land and property.
Gates prefers the "old economy" over the "new economy"
Gates' criticism of Bitcoin and cryptocurrency ventures isn't surprising. These digital assets lack all of Gates's investing criteria.
Volatile digital assets include Bitcoin. Their costs might change dramatically in a day. Volatility scares risk-averse investors like Gates.
Gates has a stake in the old financial system. As Microsoft's co-founder, Gates helped develop a dominant tech company.
Because of his business, he's one of the world's richest men.
Bill Gates is invested in protecting the current paradigm.
He won't invest in anything that could destroy the global economy.
When Gates criticizes Bitcoin, cryptocurrencies, and NFTs, he's suggesting they're a hoax. These soapbox speeches are one way he protects his interests.
Digital assets aren't a bad investment, though. Many think they're the future.
Changpeng Zhao and Brian Armstrong are two digital asset billionaires. Two crypto exchange CEOs. Binance/Coinbase.
Digital asset revolution won't end soon.
If you disagree with Bill Gates and plan to invest in Bitcoin, cryptocurrencies, or NFTs, do your own research and understand the risks.
But don’t take Bill Gates’ word for it.
He’s just an old rich guy with a lot of farmland.
He has a lot to lose if Bitcoin and other digital assets gain global popularity.
This post is a summary. Read the full article here.
You might also like

Boris Müller
3 years ago
Why Do Websites Have the Same Design?
My kids redesigned the internet because it lacks inventiveness.

Internet today is bland. Everything is generic: fonts, layouts, pages, and visual language. Microtypography is messy.
Web design today seems dictated by technical and ideological constraints rather than creativity and ideas. Text and graphics are in containers on every page. All design is assumed.
Ironically, web technologies can design a lot. We can execute most designs. We make shocking, evocative websites. Experimental typography, generating graphics, and interactive experiences are possible.
Even designer websites use containers in containers. Dribbble and Behance, the two most popular creative websites, are boring. Lead image.
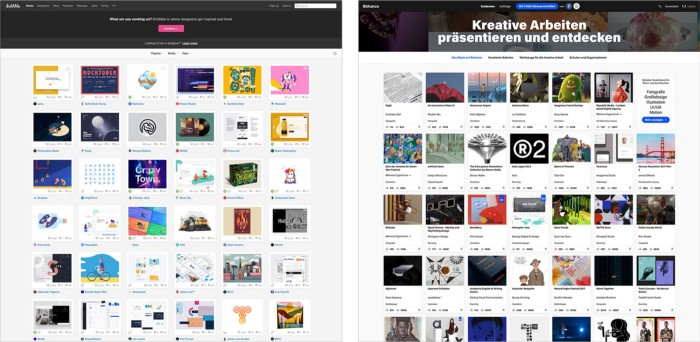
How did this happen?
Several reasons. WordPress and other blogging platforms use templates. These frameworks build web pages by combining graphics, headlines, body content, and videos. Not designs, templates. These rules combine related data types. These platforms don't let users customize pages beyond the template. You filled the template.
Templates are content-neutral. Thus, the issue.
Form should reflect and shape content, which is a design principle. Separating them produces content containers. Templates have no design value.
One of the fundamental principles of design is a deep and meaningful connection between form and content.
Web design lacks imagination for many reasons. Most are pragmatic and economic. Page design takes time. Large websites lack the resources to create a page from scratch due to the speed of internet news and the frequency of new items. HTML, JavaScript, and CSS continue to challenge web designers. Web design can't match desktop publishing's straightforward operations.
Designers may also be lazy. Mobile-first, generic, framework-driven development tends to ignore web page visual and contextual integrity.
How can we overcome this? How might expressive and avant-garde websites look today?
Rediscovering the past helps design the future.
'90s-era web design
At the University of the Arts Bremen's research and development group, I created my first website 23 years ago. Web design was trendy. Young web. Pages inspired me.
We struggled with HTML in the mid-1990s. Arial, Times, and Verdana were the only web-safe fonts. Anything exciting required table layouts, monospaced fonts, or GIFs. HTML was originally content-driven, thus we had to work against it to create a page.
Experimental typography was booming. Designers challenged the established quo from Jan Tschichold's Die Neue Typographie in the twenties to April Greiman's computer-driven layouts in the eighties. By the mid-1990s, an uncommon confluence of technological and cultural breakthroughs enabled radical graphic design. Irma Boom, David Carson, Paula Scher, Neville Brody, and others showed it.
Early web pages were dull compared to graphic design's aesthetic explosion. The Web Design Museum shows this.
Nobody knew how to conduct browser-based graphic design. Web page design was undefined. No standards. No CMS (nearly), CSS, JS, video, animation.
Now is as good a time as any to challenge the internet’s visual conformity.
In 2018, everything is browser-based. Massive layouts to micro-typography, animation, and video. How do we use these great possibilities? Containerized containers. JavaScript-contaminated mobile-first pages. Visually uniform templates. Web design 23 years later would disappoint my younger self.
Our imagination, not technology, restricts web design. We're too conformist to aesthetics, economics, and expectations.
Crisis generates opportunity. Challenge online visual conformity now. I'm too old and bourgeois to develop a radical, experimental, and cutting-edge website. I can ask my students.
I taught web design at the Potsdam Interface Design Programme in 2017. Each team has to redesign a website. Create expressive, inventive visual experiences on the browser. Create with contemporary web technologies. Avoid usability, readability, and flexibility concerns. Act. Ignore Erwartungskonformität.
The class outcome pleased me. This overview page shows all results. Four diverse projects address the challenge.
1. ZKM by Frederic Haase and Jonas Köpfer

Frederic and Jonas began their experiments on the ZKM website. The ZKM is Germany's leading media art exhibition location, but its website remains conventional. It's useful but not avant-garde like the shows' art.
Frederic and Jonas designed the ZKM site's concept, aesthetic language, and technical configuration to reflect the museum's progressive approach. A generative design engine generates new layouts for each page load.
ZKM redesign.
2. Streem by Daria Thies, Bela Kurek, and Lucas Vogel
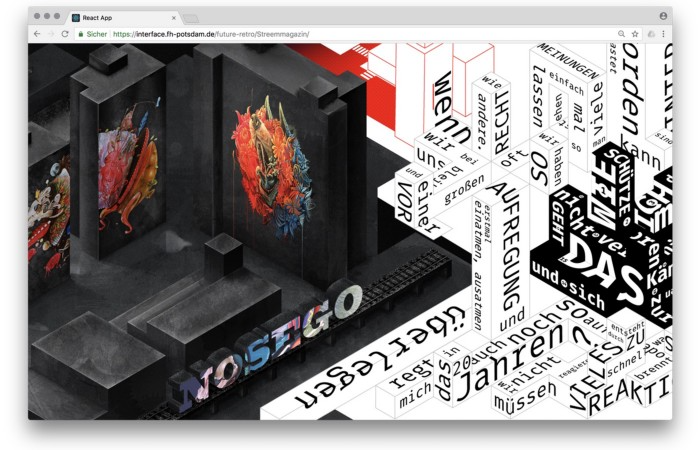
Street art magazine Streem. It promotes new artists and societal topics. Streem includes artwork, painting, photography, design, writing, and journalism. Daria, Bela, and Lucas used these influences to develop a conceptual metropolis. They designed four neighborhoods to reflect magazine sections for their prototype. For a legible city, they use powerful illustrative styles and spatial typography.
Streem makeover.
3. Medium by Amelie Kirchmeyer and Fabian Schultz
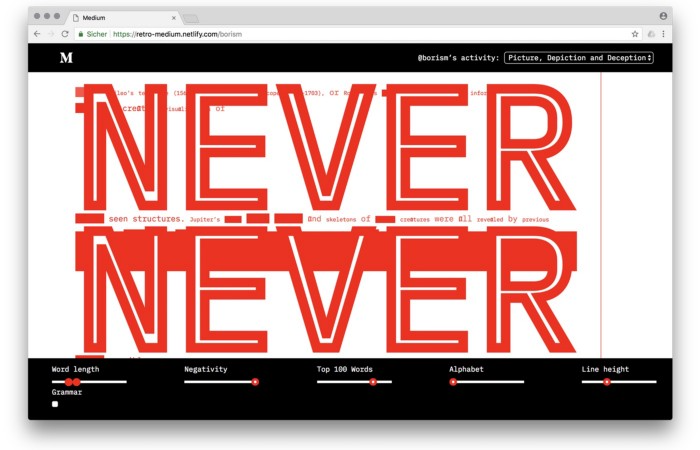
Amelie and Fabian structured. Instead of developing a form for a tale, they dissolved a web page into semantic, syntactical, and statistical aspects. HTML's flexibility was their goal. They broke Medium posts into experimental typographic space.
Medium revamp.
4. Hacker News by Fabian Dinklage and Florian Zia
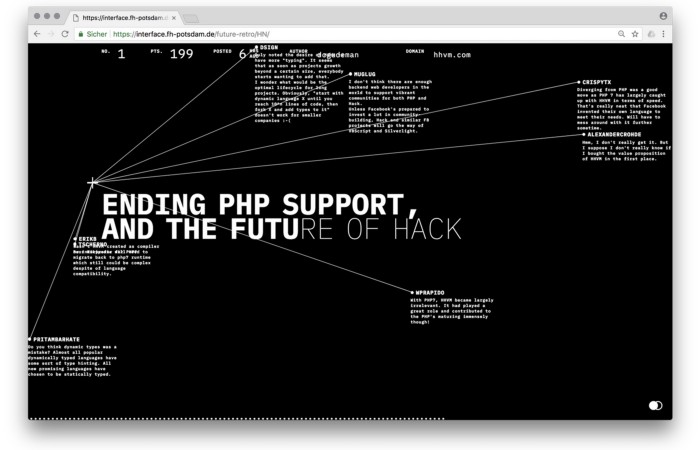
Florian and Fabian made Hacker News interactive. The social networking site aggregates computer science and IT news. Its voting and debate features are extensive despite its simple style. Fabian and Florian transformed the structure into a typographic timeline and network area. News and comments sequence and connect the visuals. To read Hacker News, they connected their design to the API. Hacker News makeover.
Communication is not legibility, said Carson. Apply this to web design today. Modern websites must be legible, usable, responsive, and accessible. They shouldn't limit its visual palette. Visual and human-centered design are not stereotypes.
I want radical, generative, evocative, insightful, adequate, content-specific, and intelligent site design. I want to rediscover web design experimentation. More surprises please. I hope the web will appear different in 23 years.
Update: this essay has sparked a lively discussion! I wrote a brief response to the debate's most common points: Creativity vs. Usability

Sofien Kaabar, CFA
3 years ago
How to Make a Trading Heatmap
Python Heatmap Technical Indicator

Heatmaps provide an instant overview. They can be used with correlations or to predict reactions or confirm the trend in trading. This article covers RSI heatmap creation.
The Market System
Market regime:
Bullish trend: The market tends to make higher highs, which indicates that the overall trend is upward.
Sideways: The market tends to fluctuate while staying within predetermined zones.
Bearish trend: The market has the propensity to make lower lows, indicating that the overall trend is downward.
Most tools detect the trend, but we cannot predict the next state. The best way to solve this problem is to assume the current state will continue and trade any reactions, preferably in the trend.
If the EURUSD is above its moving average and making higher highs, a trend-following strategy would be to wait for dips before buying and assuming the bullish trend will continue.
Indicator of Relative Strength
J. Welles Wilder Jr. introduced the RSI, a popular and versatile technical indicator. Used as a contrarian indicator to exploit extreme reactions. Calculating the default RSI usually involves these steps:
Determine the difference between the closing prices from the prior ones.
Distinguish between the positive and negative net changes.
Create a smoothed moving average for both the absolute values of the positive net changes and the negative net changes.
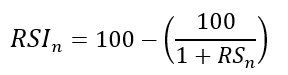
Take the difference between the smoothed positive and negative changes. The Relative Strength RS will be the name we use to describe this calculation.
To obtain the RSI, use the normalization formula shown below for each time step.
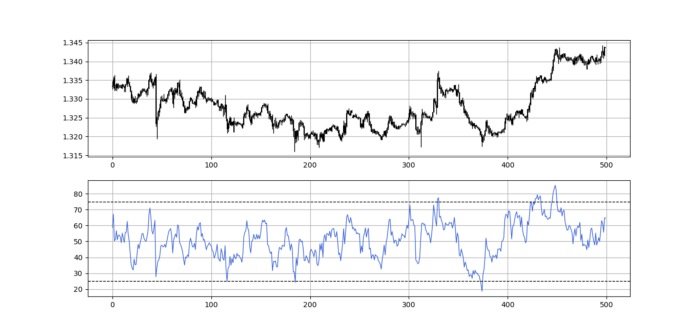
The 13-period RSI and black GBPUSD hourly values are shown above. RSI bounces near 25 and pauses around 75. Python requires a four-column OHLC array for RSI coding.
import numpy as np
def add_column(data, times):

    for i in range(1, times + 1):

        new = np.zeros((len(data), 1), dtype = float)

        data = np.append(data, new, axis = 1)
    return data
def delete_column(data, index, times):

    for i in range(1, times + 1):

        data = np.delete(data, index, axis = 1)
    return data
def delete_row(data, number):

    data = data[number:, ]

    return data
def ma(data, lookback, close, position):

    data = add_column(data, 1)

    for i in range(len(data)):

            try:

                data[i, position] = (data[i - lookback + 1:i + 1, close].mean())

            except IndexError:

                pass

    data = delete_row(data, lookback)

    return data
def smoothed_ma(data, alpha, lookback, close, position):

    lookback = (2 * lookback) - 1

    alpha = alpha / (lookback + 1.0)

    beta  = 1 - alpha

    data = ma(data, lookback, close, position)
    data[lookback + 1, position] = (data[lookback + 1, close] * alpha) + (data[lookback, position] * beta)
    for i in range(lookback + 2, len(data)):

            try:

                data[i, position] = (data[i, close] * alpha) + (data[i - 1, position] * beta)

            except IndexError:

                pass

    return data
def rsi(data, lookback, close, position):

    data = add_column(data, 5)

    for i in range(len(data)):

        data[i, position] = data[i, close] - data[i - 1, close]

    for i in range(len(data)):

        if data[i, position] > 0:

            data[i, position + 1] = data[i, position]

        elif data[i, position] < 0:

            data[i, position + 2] = abs(data[i, position])

    data = smoothed_ma(data, 2, lookback, position + 1, position + 3)
    data = smoothed_ma(data, 2, lookback, position + 2, position + 4)
    data[:, position + 5] = data[:, position + 3] / data[:, position + 4]

    data[:, position + 6] = (100 - (100 / (1 + data[:, position + 5])))
    data = delete_column(data, position, 6)
    data = delete_row(data, lookback)
    return data
Make sure to focus on the concepts and not the code. You can find the codes of most of my strategies in my books. The most important thing is to comprehend the techniques and strategies.
My weekly market sentiment report uses complex and simple models to understand the current positioning and predict the future direction of several major markets. Check out the report here:
Using the Heatmap to Find the Trend
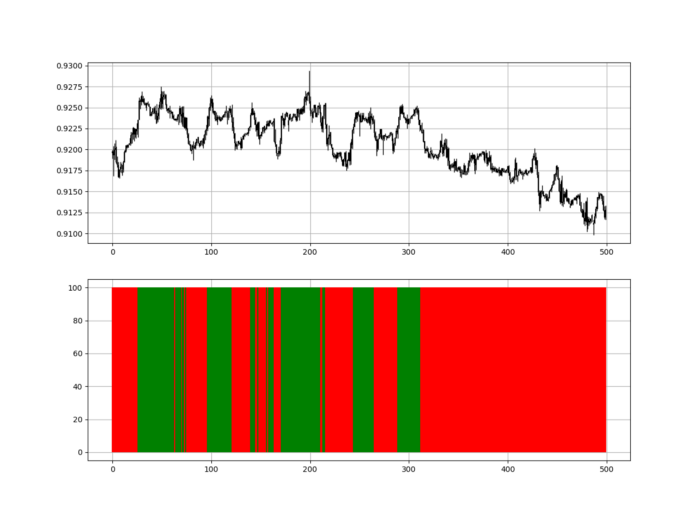
RSI trend detection is easy but useless. Bullish and bearish regimes are in effect when the RSI is above or below 50, respectively. Tracing a vertical colored line creates the conditions below. How:
When the RSI is higher than 50, a green vertical line is drawn.
When the RSI is lower than 50, a red vertical line is drawn.
Zooming out yields a basic heatmap, as shown below.
Plot code:
def indicator_plot(data, second_panel, window = 250):
    fig, ax = plt.subplots(2, figsize = (10, 5))
    sample = data[-window:, ]
    for i in range(len(sample)):
        ax[0].vlines(x = i, ymin = sample[i, 2], ymax = sample[i, 1], color = 'black', linewidth = 1)
        if sample[i, 3] > sample[i, 0]:
            ax[0].vlines(x = i, ymin = sample[i, 0], ymax = sample[i, 3], color = 'black', linewidth = 1.5)
        if sample[i, 3] < sample[i, 0]:
            ax[0].vlines(x = i, ymin = sample[i, 3], ymax = sample[i, 0], color = 'black', linewidth = 1.5)
        if sample[i, 3] == sample[i, 0]:
            ax[0].vlines(x = i, ymin = sample[i, 3], ymax = sample[i, 0], color = 'black', linewidth = 1.5)
    ax[0].grid()
    for i in range(len(sample)):
        if sample[i, second_panel] > 50:
            ax[1].vlines(x = i, ymin = 0, ymax = 100, color = 'green', linewidth = 1.5)
        if sample[i, second_panel] < 50:
            ax[1].vlines(x = i, ymin = 0, ymax = 100, color = 'red', linewidth = 1.5)
    ax[1].grid()
indicator_plot(my_data, 4, window = 500)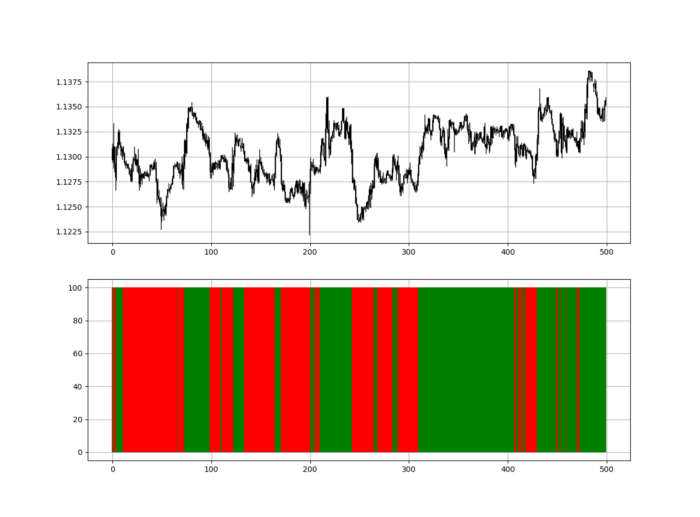
Call RSI on your OHLC array's fifth column. 4. Adjusting lookback parameters reduces lag and false signals. Other indicators and conditions are possible.
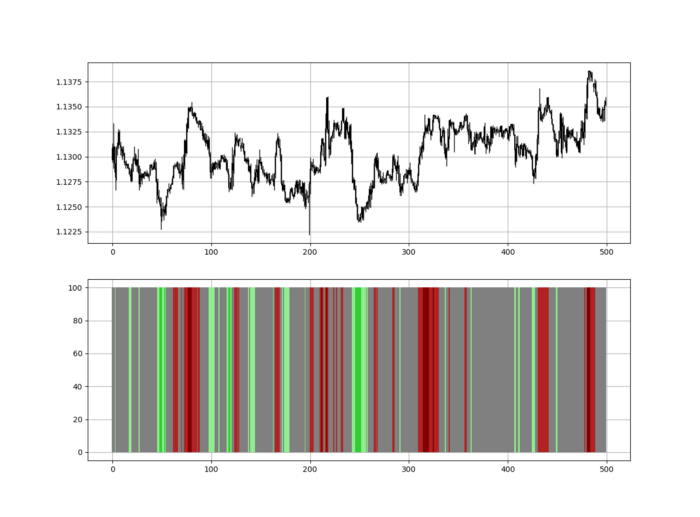
Another suggestion is to develop an RSI Heatmap for Extreme Conditions.
Contrarian indicator RSI. The following rules apply:
Whenever the RSI is approaching the upper values, the color approaches red.
The color tends toward green whenever the RSI is getting close to the lower values.
Zooming out yields a basic heatmap, as shown below.
Plot code:
import matplotlib.pyplot as plt
def indicator_plot(data, second_panel, window = 250):
    fig, ax = plt.subplots(2, figsize = (10, 5))
    sample = data[-window:, ]
    for i in range(len(sample)):
        ax[0].vlines(x = i, ymin = sample[i, 2], ymax = sample[i, 1], color = 'black', linewidth = 1)
        if sample[i, 3] > sample[i, 0]:
            ax[0].vlines(x = i, ymin = sample[i, 0], ymax = sample[i, 3], color = 'black', linewidth = 1.5)
        if sample[i, 3] < sample[i, 0]:
            ax[0].vlines(x = i, ymin = sample[i, 3], ymax = sample[i, 0], color = 'black', linewidth = 1.5)
        if sample[i, 3] == sample[i, 0]:
            ax[0].vlines(x = i, ymin = sample[i, 3], ymax = sample[i, 0], color = 'black', linewidth = 1.5)
    ax[0].grid()
    for i in range(len(sample)):
        if sample[i, second_panel] > 90:
            ax[1].vlines(x = i, ymin = 0, ymax = 100, color = 'red', linewidth = 1.5)
        if sample[i, second_panel] > 80 and sample[i, second_panel] < 90:
            ax[1].vlines(x = i, ymin = 0, ymax = 100, color = 'darkred', linewidth = 1.5)
        if sample[i, second_panel] > 70 and sample[i, second_panel] < 80:
            ax[1].vlines(x = i, ymin = 0, ymax = 100, color = 'maroon', linewidth = 1.5)
        if sample[i, second_panel] > 60 and sample[i, second_panel] < 70:
            ax[1].vlines(x = i, ymin = 0, ymax = 100, color = 'firebrick', linewidth = 1.5)
        if sample[i, second_panel] > 50 and sample[i, second_panel] < 60:
            ax[1].vlines(x = i, ymin = 0, ymax = 100, color = 'grey', linewidth = 1.5)
        if sample[i, second_panel] > 40 and sample[i, second_panel] < 50:
            ax[1].vlines(x = i, ymin = 0, ymax = 100, color = 'grey', linewidth = 1.5)
        if sample[i, second_panel] > 30 and sample[i, second_panel] < 40:
            ax[1].vlines(x = i, ymin = 0, ymax = 100, color = 'lightgreen', linewidth = 1.5)
        if sample[i, second_panel] > 20 and sample[i, second_panel] < 30:
            ax[1].vlines(x = i, ymin = 0, ymax = 100, color = 'limegreen', linewidth = 1.5)
        if sample[i, second_panel] > 10 and sample[i, second_panel] < 20:
            ax[1].vlines(x = i, ymin = 0, ymax = 100, color = 'seagreen', linewidth = 1.5)
        if sample[i, second_panel] > 0 and sample[i, second_panel] < 10:
            ax[1].vlines(x = i, ymin = 0, ymax = 100, color = 'green', linewidth = 1.5)
    ax[1].grid()
indicator_plot(my_data, 4, window = 500)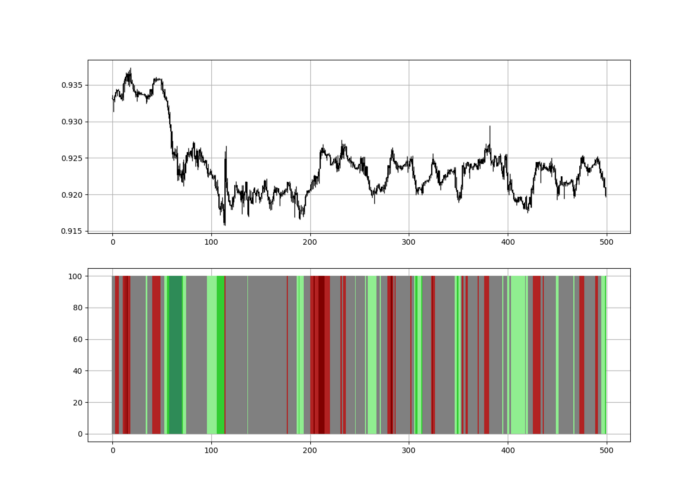
Dark green and red areas indicate imminent bullish and bearish reactions, respectively. RSI around 50 is grey.
Summary
To conclude, my goal is to contribute to objective technical analysis, which promotes more transparent methods and strategies that must be back-tested before implementation.
Technical analysis will lose its reputation as subjective and unscientific.
When you find a trading strategy or technique, follow these steps:
Put emotions aside and adopt a critical mindset.
Test it in the past under conditions and simulations taken from real life.
Try optimizing it and performing a forward test if you find any potential.
Transaction costs and any slippage simulation should always be included in your tests.
Risk management and position sizing should always be considered in your tests.
After checking the above, monitor the strategy because market dynamics may change and make it unprofitable.

Adam Frank
4 years ago
Humanity is not even a Type 1 civilization. What might a Type 3 be capable of?

The Kardashev scale grades civilizations from Type 1 to Type 3 based on energy harvesting.
How do technologically proficient civilizations emerge across timescales measuring in the tens of thousands or even millions of years? This is a question that worries me as a researcher in the search for “technosignatures” from other civilizations on other worlds. Since it is already established that longer-lived civilizations are the ones we are most likely to detect, knowing something about their prospective evolutionary trajectories could be translated into improved search tactics. But even more than knowing what to seek for, what I really want to know is what happens to a society after so long time. What are they capable of? What do they become?
This was the question Russian SETI pioneer Nikolai Kardashev asked himself back in 1964. His answer was the now-famous “Kardashev Scale.” Kardashev was the first, although not the last, scientist to try and define the processes (or stages) of the evolution of civilizations. Today, I want to launch a series on this question. It is crucial to technosignature studies (of which our NASA team is hard at work), and it is also important for comprehending what might lay ahead for mankind if we manage to get through the bottlenecks we have now.
The Kardashev scale
Kardashev’s question can be expressed another way. What milestones in a civilization’s advancement up the ladder of technical complexity will be universal? The main notion here is that all (or at least most) civilizations will pass through some kind of definable stages as they progress, and some of these steps might be mirrored in how we could identify them. But, while Kardashev’s major focus was identifying signals from exo-civilizations, his scale gave us a clear way to think about their evolution.
The classification scheme Kardashev employed was not based on social systems of ethics because they are something that we can probably never predict about alien cultures. Instead, it was built on energy, which is something near and dear to the heart of everybody trained in physics. Energy use might offer the basis for universal stages of civilisation progression because you cannot do the work of establishing a civilization without consuming energy. So, Kardashev looked at what energy sources were accessible to civilizations as they evolved technologically and used those to build his scale.
From Kardashev’s perspective, there are three primary levels or “types” of advancement in terms of harvesting energy through which a civilization should progress.
Type 1: Civilizations that can capture all the energy resources of their native planet constitute the first stage. This would imply capturing all the light energy that falls on a world from its host star. This makes it reasonable, given solar energy will be the largest source available on most planets where life could form. For example, Earth absorbs hundreds of atomic bombs’ worth of energy from the Sun every second. That is a rather formidable energy source, and a Type 1 race would have all this power at their disposal for civilization construction.
Type 2: These civilizations can extract the whole energy resources of their home star. Nobel Prize-winning scientist Freeman Dyson famously anticipated Kardashev’s thinking on this when he imagined an advanced civilization erecting a large sphere around its star. This “Dyson Sphere” would be a machine the size of the complete solar system for gathering stellar photons and their energy.
Type 3: These super-civilizations could use all the energy produced by all the stars in their home galaxy. A normal galaxy has a few hundred billion stars, so that is a whole lot of energy. One way this may be done is if the civilization covered every star in their galaxy with Dyson spheres, but there could also be more inventive approaches.
Implications of the Kardashev scale
Climbing from Type 1 upward, we travel from the imaginable to the god-like. For example, it is not hard to envisage utilizing lots of big satellites in space to gather solar energy and then beaming that energy down to Earth via microwaves. That would get us to a Type 1 civilization. But creating a Dyson sphere would require chewing up whole planets. How long until we obtain that level of power? How would we have to change to get there? And once we get to Type 3 civilizations, we are virtually thinking about gods with the potential to engineer the entire cosmos.
For me, this is part of the point of the Kardashev scale. Its application for thinking about identifying technosignatures is crucial, but even more strong is its capacity to help us shape our imaginations. The mind might become blank staring across hundreds or thousands of millennia, and so we need tools and guides to focus our attention. That may be the only way to see what life might become — what we might become — once it arises to start out beyond the boundaries of space and time and potential.
This is a summary. Read the full article here.