


Working from home for more than two years has taught me a lot.
Since the pandemic, I've worked from home. It’s been +2 years (wow, time flies!) now, and during this time I’ve learned a lot. My 4 remote work lessons.
I work in a remote distributed team. This team setting shaped my experience and teachings.
Isolation ("I miss my coworkers")
The most obvious point. I miss going out with my coworkers for coffee, weekend chats, or just company while I work. I miss being able to go to someone's desk and ask for help. On a remote world, I must organize a meeting, share my screen, and avoid talking over each other in Zoom - sigh!
Social interaction is more vital for my health than I believed.
Online socializing stinks
My company used to come together every Friday to play Exploding Kittens, have food and beer, and bond over non-work things.
Different today. Every Friday afternoon is for fun, but it's not the same. People with screen weariness miss meetings, which makes sense. Sometimes you're too busy on Slack to enjoy yourself.
We laugh in meetings, but it's not the same as face-to-face.
Digital social activities can't replace real-world ones
Improved Work-Life Balance, if You Let It
At the outset of the pandemic, I recognized I needed to take better care of myself to survive. After not leaving my apartment for a few days and feeling miserable, I decided to walk before work every day. This turned into a passion for exercise, and today I run or go to the gym before work. I use my commute time for healthful activities.
Working from home makes it easier to keep working after hours. I sometimes forget the time and find myself writing coding at dinnertime. I said, "One more test." This is a disadvantage, therefore I keep my office schedule.
Spend your commute time properly and keep to your office schedule.
Remote Pair Programming Is Hard
As a software developer, I regularly write code. My team sometimes uses pair programming to write code collaboratively. One person writes code while another watches, comments, and asks questions. I won't list them all here.
Internet pairing is difficult. My team struggles with this. Even with Tuple, it's challenging. I lose attention when I get a notification or check my computer.
I miss a pen and paper to rapidly sketch down my thoughts for a colleague or a whiteboard for spirited talks with others. Best answers are found through experience.
Real-life pair programming beats the best remote pair programming tools.
Lessons Learned
Here are 4 lessons I've learned working remotely for 2 years.
-
Socializing is more vital to my health than I anticipated.
-
Digital social activities can't replace in-person ones.
-
Spend your commute time properly and keep your office schedule.
-
Real-life pair programming beats the best remote tools.
Conclusion
Our era is fascinating. Remote labor has existed for years, but software companies have just recently had to adapt. Companies who don't offer remote work will lose talent, in my opinion.
We're still figuring out the finest software development approaches, programming language features, and communication methods since the 1960s. I can't wait to see what advancements assist us go into remote work.
I'll certainly work remotely in the next years, so I'm interested to see what I've learnt from this post then.
This post is a summary of this one.
More on Productivity

The woman
3 years ago
I received a $2k bribe to replace another developer in an interview
I can't believe they’d even think it works!
Developers are usually interviewed before being hired, right? Every organization wants candidates who meet their needs. But they also want to avoid fraud.
There are cheaters in every field. Only two come to mind for the hiring process:
Lying on a resume.
Cheating on an online test.
Recently, I observed another one. One of my coworkers invited me to replace another developer during an online interview! I was astonished, but it’s not new.
The specifics
My ex-colleague recently texted me. No one from your former office will ever approach you after a year unless they need something.
Which was the case. My coworker said his wife needed help as a programmer. I was glad someone asked for my help, but I'm still a junior programmer.
Then he informed me his wife was selected for a fantastic job interview. He said he could help her with the online test, but he needed someone to help with the online interview.
Okay, I guess. Preparing for an online interview is beneficial. But then he said she didn't need to be ready. She needed someone to take her place.
I told him it wouldn't work. Every remote online interview I've ever seen required an open camera.
What followed surprised me. She'd ask to turn off the camera, he said.
I asked why.
He told me if an applicant is unwell, the interviewer may consider an off-camera interview. His wife will say she's sick and prefers no camera.
The plan left me speechless. I declined politely. He insisted and promised $2k if she got the job.
I felt insulted and told him if he persisted, I'd inform his office. I was furious. Later, I apologized and told him to stop.
I'm not sure what they did after that
I'm not sure if they found someone or listened to me. They probably didn't. How would she do the job if she even got it?
It's an internship, he said. With great pay, though. What should an intern do?
I suggested she do the interview alone. Even if she failed, she'd gain confidence and valuable experience.
Conclusion
Many interviewees cheat. My profession is vital to me, thus I'd rather improve my abilities and apply honestly. It's part of my identity.
Am I truthful? Most professionals are not. They fabricate their CVs. Often.
When you support interview cheating, you encourage more cheating! When someone cheats, another qualified candidate may not obtain the job.
One day, that could be you or me.

Ellane W
3 years ago
The Last To-Do List Template I'll Ever Need, Years in the Making
The holy grail of plain text task management is finally within reach

Plain text task management? Are you serious?? Dedicated task managers exist for a reason, you know. Sheesh.
—Oh, I know. Believe me, I know! But hear me out.
I've managed projects and tasks in plain text for more than four years. Since reorganizing my to-do list, plain text task management is within reach.
Data completely yours? One billion percent. Beef it up with coding? Be my guest.
Enter: The List
The answer? A list. That’s it!
Write down tasks. Obsidian, Notenik, Drafts, or iA Writer are good plain text note-taking apps.
List too long? Of course, it is! A large list tells you what to do. Feel the itch and friction. Then fix it.
But I want to be able to distinguish between work and personal life! List two things.
However, I need to know what should be completed first. Put those items at the top.
However, some things keep coming up, and I need to be reminded of them! Put those in your calendar and make an alarm for them.
But since individual X hasn't completed task Y, I can't proceed with this. Create a Waiting section on your list by dividing it.
But I must know what I'm supposed to be doing right now! Read your list(s). Check your calendar. Think critically.
Before I begin a new one, I remind myself that "Listory Never Repeats."
There’s no such thing as too many lists if all are needed. There is such a thing as too many lists if you make them before they’re needed. Before they complain that their previous room was small or too crowded or needed a new light.
A list that feels too long has a voice; it’s telling you what to do next.
I use one Master List. It's a control panel that tells me what to focus on short-term. If something doesn't need semi-immediate attention, it goes on my Backlog list.
Todd Lewandowski's DWTS (Done, Waiting, Top 3, Soon) performance deserves praise. His DWTS to-do list structure has transformed my plain-text task management. I didn't realize it was upside down.
This is my take on it:
D = Done
Move finished items here. If they pile up, clear them out every week or month. I have a Done Archive folder.
W = Waiting
Things seething in the background, awaiting action. Stir them occasionally so they don't burn.
T = Top 3
Three priorities. Personal comes first, then work. There will always be a top 3 (no more than 5) in every category. Projects, not chores, usually.
S = Soon
This part is action-oriented. It's for anything you can accomplish to finish one of the Top 3. This collection includes thoughts and project lists. The sole requirement is that they should be short-term goals.
Some of you have probably concluded this isn't for you. Please read Todd's piece before throwing out the baby. Often. You shouldn't miss a newborn.
As much as Dancing With The Stars helps me recall this method, I may try switching their order. TSWD; Drilling Tunnel Seismic? Serenity After Task?
Master List Showcase
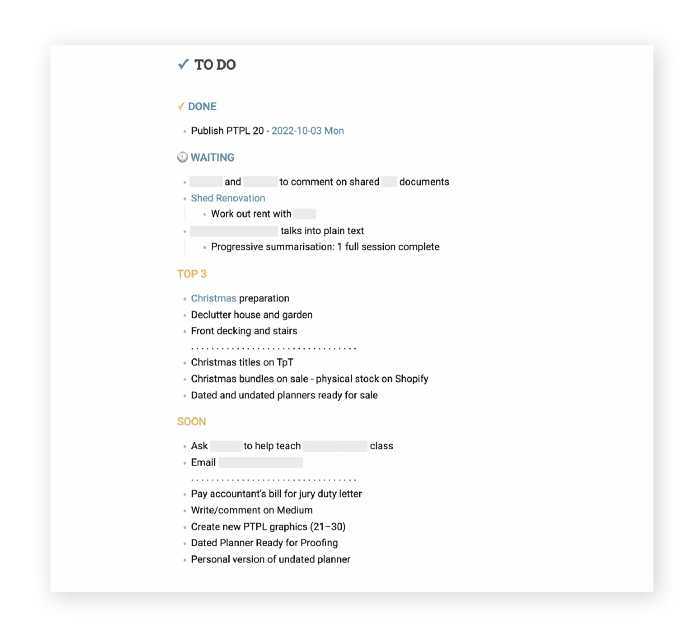
My Master List lives alone in its own file, but sometimes appears in other places. It's included in my Weekly List template. Here's a (soon-to-be-updated) demo vault of my Obsidian planning setup to download for free.
Here's the code behind my weekly screenshot:
## [[Master List - 2022|✓]]  TO DO

![[Master List - 2022]]
FYI, I use the Minimal Theme in Obsidian, with a few tweaks.
You may note I'm utilizing a checkmark as a link. For me, that's easier than locating the proper spot to click on the embed.
Blue headings for Done and Waiting are links. Done links to the Done Archive page and Waiting to a general waiting page.
Read my full article here.

Deon Ashleigh
3 years ago
You can dominate your daily productivity with these 9 little-known Google Calendar tips.
Calendars are great unpaid employees.
After using Notion to organize my next three months' goals, my days were a mess.
I grew very chaotic afterward. I was overwhelmed, unsure of what to do, and wasting time attempting to plan the day after it had started.
Imagine if our skeletons were on the outside. Doesn’t work.
The goals were too big; I needed to break them into smaller chunks. But how?
Enters Google Calendar
RescueTime’s recommendations took me seven hours to make a daily planner. This epic narrative begins with a sheet of paper and concludes with a daily calendar that helps me focus and achieve more goals. Ain’t nobody got time for “what’s next?” all day.
Onward!
Return to the Paleolithic Era
Plan in writing.
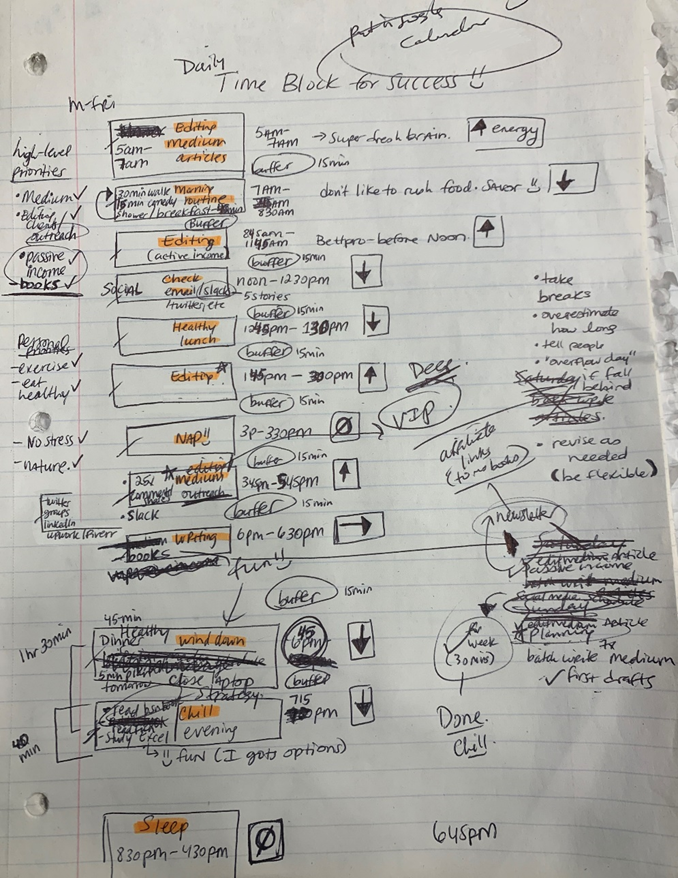
Not on the list, but it helped me plan my day. Physical writing boosts creativity and recall.
Find My Heart
i.e. prioritize
RescueTime suggested I prioritize before planning. Personal and business goals were proposed.
My top priorities are to exercise, eat healthily, spend time in nature, and avoid stress.
Priorities include writing and publishing Medium articles, conducting more freelance editing and Medium outreach, and writing/editing sci-fi books.
These eight things will help me feel accomplished every day.
Make a baby calendar.
Create daily calendar templates.
Make family, pleasure, etc. calendars.
Google Calendar instructions:
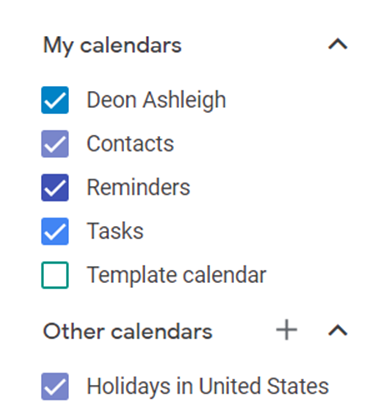
Other calendars
Press the “+” button
Create a new calendar
Create recurring events for each day
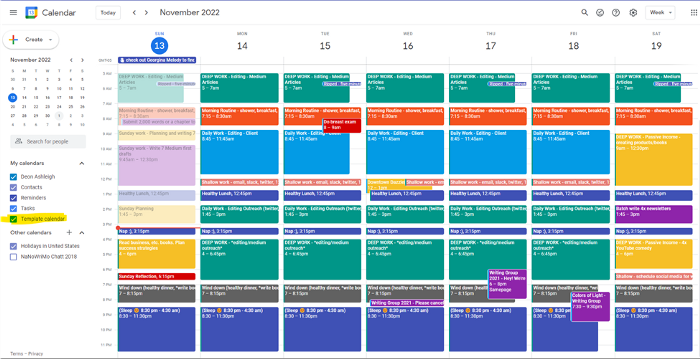
My calendar, without the template:
Empty, so I can fill it with vital tasks.
With the template:
My daily skeleton corresponds with my priorities. I've been overwhelmed for years because I lack daily, weekly, monthly, and yearly structure.
Google Calendars helps me reach my goals and focus my energy.
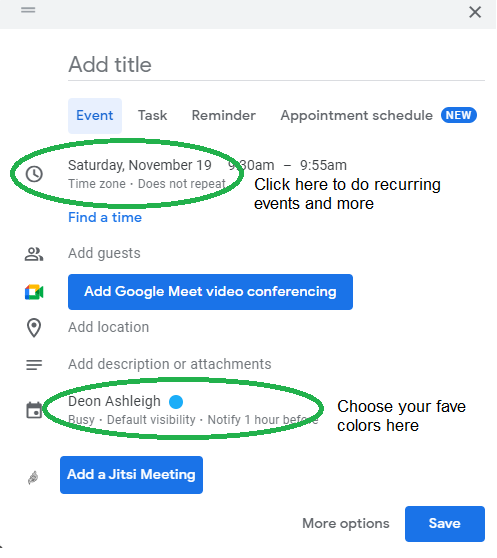
Get your colored pencils ready
Time-block color-coding.
Color labeling lets me quickly see what's happening. Maybe you are too.
Google Calendar instructions:
Determine which colors correspond to each time block.
When establishing new events, select a color.
Save
My calendar is color-coded as follows:
Yellow — passive income or other future-related activities
Red — important activities, like my monthly breast exam
Flamingo — shallow work, like emails, Twitter, etc.
Blue — all my favorite activities, like walking, watching comedy, napping, and sleeping. Oh, and eating.
Green — money-related events required for this adulting thing
Purple — writing-related stuff
Associating a time block with a color helps me stay focused. Less distractions mean faster work.
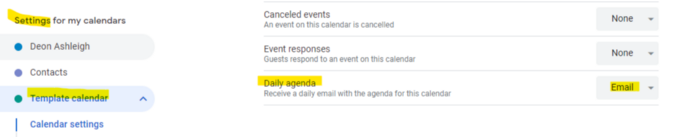
Open My Email
aka receive a daily email from Google Calendar.
Google Calendar sends a daily email feed of your calendars. I sent myself the template calendar in this email.
Google Calendar instructions:
Access settings
Select the calendar that you want to send (left side)
Go down the page to see more alerts
Under the daily agenda area, click Email.
Get in Touch With Your Red Bull Wings — Naturally
aka audit your energy levels.
My daily planner has arrows. These indicate how much energy each activity requires or how much I have.
Rightward arrow denotes medium energy.
I do my Medium and professional editing in the morning because it's energy-intensive.
Niharikaa Sodhi recommends morning Medium editing.
I’m a morning person. As long as I go to bed at a reasonable time, 5 a.m. is super wild GO-TIME. It’s like the world was just born, and I marvel at its wonderfulness.
Freelance editing lets me do what I want. An afternoon snooze will help me finish on time.
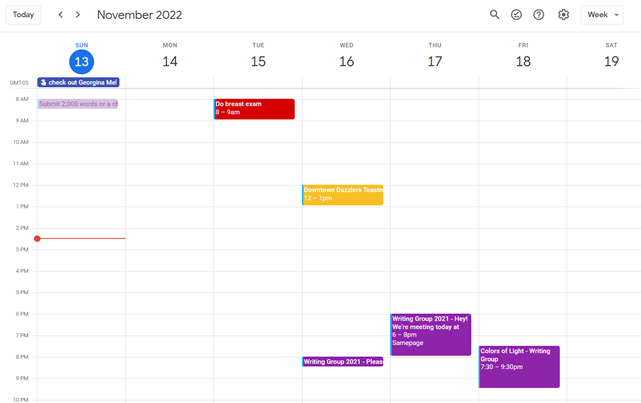
Ditch Schedule View
aka focus on the weekly view.
RescueTime advocated utilizing the weekly view of Google Calendar, so I switched.
When you launch the phone app or desktop calendar, a red line shows where you are in the day.
I'll follow the red line's instructions. My digital supervisor is easy to follow.
In the image above, it's almost 3 p.m., therefore the red line implies it's time to snooze.
I won't forget this block ;).
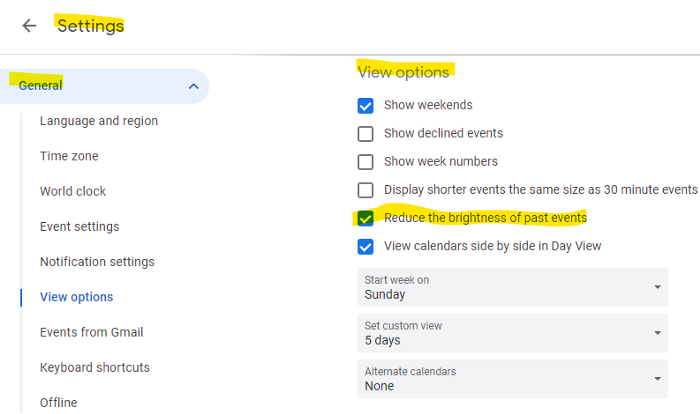
Reduce the Lighting
aka dim previous days.
This is another Google Calendar feature I didn't know about. Once the allotted time passes, the time block dims. This keeps me present.
Google Calendar instructions:
Access settings
remaining general
To view choices, click.
Check Diminish the glare of the past.
Bonus
Two additional RescueTimes hacks:
Maintain a space between tasks
I left 15 minutes between each time block to transition smoothly. This relates to my goal of less stress. If I set strict start and end times, I'll be stressed.
With a buffer, I can breathe, stroll around, and start the following time block fresh.
Find a time is related to the buffer.
This option allows you conclude small meetings five minutes early and longer ones ten. Before the next meeting, relax or go wild.
Decide on a backup day.
This productivity technique is amazing.
Spend this excess day catching up on work. It helps reduce tension and clutter.
That's all I can say about Google Calendar's functionality.
You might also like
Jamie Ducharme
3 years ago
How monkeypox spreads (and doesn't spread)

Monkeypox was rare until recently. In 2005, a research called a cluster of six monkeypox cases in the Republic of Congo "the longest reported chain to date."
That's changed. This year, over 25,000 monkeypox cases have been reported in 83 countries, indicating widespread human-to-human transmission.
What spreads monkeypox? Monkeypox transmission research is ongoing; findings may change. But science says...
Most cases were formerly animal-related.
According to the WHO, monkeypox was first diagnosed in an infant in the DRC in 1970. After that, instances were infrequent and often tied to animals. In 2003, 47 Americans contracted rabies from pet prairie dogs.
In 2017, Nigeria saw a significant outbreak. NPR reported that doctors diagnosed young guys without animal exposure who had genital sores. Nigerian researchers highlighted the idea of sexual transmission in a 2019 study, but the theory didn't catch on. “People tend to cling on to tradition, and the idea is that monkeypox is transmitted from animals to humans,” explains research co-author Dr. Dimie Ogoina.
Most monkeypox cases are sex-related.
Human-to-human transmission of monkeypox occurs, and sexual activity plays a role.
Joseph Osmundson, a clinical assistant professor of biology at NYU, says most transmission occurs in queer and gay sexual networks through sexual or personal contact.
Monkeypox spreads by skin-to-skin contact, especially with its blister-like rash, explains Ogoina. Researchers are exploring whether people can be asymptomatically contagious, but they are infectious until their rash heals and fresh skin forms, according to the CDC.
A July research in the New England Journal of Medicine reported that of more than 500 monkeypox cases in 16 countries as of June, 95% were linked to sexual activity and 98% were among males who have sex with men. WHO Director-General Tedros Adhanom Ghebreyesus encouraged males to temporarily restrict their number of male partners in July.
Is monkeypox a sexually transmitted infection (STI)?
Skin-to-skin contact can spread monkeypox, not simply sexual activities. Dr. Roy Gulick, infectious disease chief at Weill Cornell Medicine and NewYork-Presbyterian, said monkeypox is not a "typical" STI. Monkeypox isn't a STI, claims the CDC.
Most cases in the current outbreak are tied to male sexual behavior, but Osmundson thinks the virus might also spread on sports teams, in spas, or in college dorms.
Can you get monkeypox from surfaces?
Monkeypox can be spread by touching infected clothing or bedding. According to a study, a U.K. health care worker caught monkeypox in 2018 after handling ill patient's bedding.
Angela Rasmussen, a virologist at the University of Saskatchewan in Canada, believes "incidental" contact seldom distributes the virus. “You need enough virus exposure to get infected,” she says. It's conceivable after sharing a bed or towel with an infectious person, but less likely after touching a doorknob, she says.
Dr. Müge evik, a clinical lecturer in infectious diseases at the University of St. Andrews in Scotland, says there is a "spectrum" of risk connected with monkeypox. "Every exposure isn't equal," she explains. "People must know where to be cautious. Reducing [sexual] partners may be more useful than cleaning coffee shop seats.
Is monkeypox airborne?
Exposure to an infectious person's respiratory fluids can cause monkeypox, but the WHO says it needs close, continuous face-to-face contact. CDC researchers are still examining how often this happens.
Under precise laboratory conditions, scientists have shown that monkeypox can spread via aerosols, or tiny airborne particles. But there's no clear evidence that this is happening in the real world, Rasmussen adds. “This is expanding predominantly in communities of males who have sex with men, which suggests skin-to-skin contact,” she explains. If airborne transmission were frequent, she argues, we'd find more occurrences in other demographics.
In the shadow of COVID-19, people are worried about aerosolized monkeypox. Rasmussen believes the epidemiology is different. Different viruses.
Can kids get monkeypox?
More than 80 youngsters have contracted the virus thus far, mainly through household transmission. CDC says pregnant women can spread the illness to their fetus.
Among the 1970s, monkeypox predominantly affected children, but by the 2010s, it was more common in adults, according to a February study. The study's authors say routine smallpox immunization (which protects against monkeypox) halted when smallpox was eradicated. Only toddlers were born after smallpox vaccination halted decades ago. More people are vulnerable now.
Schools and daycares could become monkeypox hotspots, according to pediatric instances. Ogoina adds this hasn't happened in Nigeria's outbreaks, which is encouraging. He says, "I'm not sure if we should worry." We must be careful and seek evidence.

Jess Rifkin
4 years ago
As the world watches the Russia-Ukraine border situation, This bill would bar aid to Ukraine until the Mexican border is secured.
Although Mexico and Ukraine are thousands of miles apart, this legislation would link their responses.
Context
Ukraine was a Soviet republic until 1991. A significant proportion of the population, particularly in the east, is ethnically Russian. In February, the Russian military invaded Ukraine, intent on overthrowing its democratically elected government.
This could be the biggest European land invasion since WWII. In response, President Joe Biden sent 3,000 troops to NATO countries bordering Ukraine to help with Ukrainian refugees, with more troops possible if the situation worsened.
In July 2021, the US Border Patrol reported its highest monthly encounter total since March 2000. Some Republicans compare Biden's response to the Mexican border situation to his response to the Ukrainian border situation, though the correlation is unclear.
What the bills do
Two new Republican bills seek to link the US response to Ukraine to the situation in Mexico.
The Secure America's Borders First Act would prohibit federal funding for Ukraine until the US-Mexico border is “operationally controlled,” including a wall as promised by former President Donald Trump. (The bill even mandates a 30-foot-high wall.)
The USB (Ukraine and Southern Border) Act, introduced on February 8 by Rep. Matt Rosendale (R-MT0), would allow the US to support Ukraine, but only if the number of Armed Forces deployed there is less than the number deployed to the Mexican border. Madison Cawthorne introduced H.R. 6665 on February 9th (R-NC11).
What backers say
Supporters argue that even if the US should militarily assist Ukraine, our own domestic border situation should take precedence.
After failing to secure our own border and protect our own territorial integrity, ‘America Last' politicians on both sides of the aisle now tell us that we must do so for Ukraine. “Before rushing America into another foreign conflict over an Eastern European nation's border thousands of miles from our shores, they should first secure our southern border.”
“If Joe Biden truly cared about Americans, he would prioritize national security over international affairs,” Rep. Cawthorn said in a separate press release. The least we can do to secure our own country is send the same number of troops to the US-Mexico border to assist our border patrol agents working diligently to secure America.
What opponents say
The president has defended his Ukraine and Mexico policies, stating that both seek peace and diplomacy.
Our nations [the US and Mexico] have a long and complicated history, and we haven't always been perfect neighbors, but we have seen the power and purpose of cooperation,” Biden said in 2021. “We're safer when we work together, whether it's to manage our shared border or stop the pandemic. [In both the Obama and Biden administration], we made a commitment that we look at Mexico as an equal, not as somebody who is south of our border.”
No mistake: If Russia goes ahead with its plans, it will be responsible for a catastrophic and unnecessary war of choice. To protect our collective security, the United States and our allies are ready to defend every inch of NATO territory. We won't send troops into Ukraine, but we will continue to support the Ukrainian people... But, I repeat, Russia can choose diplomacy. It is not too late to de-escalate and return to the negotiating table.”
Odds of passage
The Secure America's Borders First Act has nine Republican sponsors. Either the House Armed Services or Foreign Affairs Committees may vote on it.
Rep. Paul Gosar, a Republican, co-sponsored the USB Act (R-AZ4). The House Armed Services Committee may vote on it.
With Republicans in control, passage is unlikely.

Chris Moyse
4 years ago
Sony and LEGO raise $2 billion for Epic Games' metaverse
‘Kid-friendly’ project holds $32 billion valuation
Epic Games announced today that it has raised $2 billion USD from Sony Group Corporation and KIRKBI (holding company of The LEGO Group). Both companies contributed $1 billion to Epic Games' upcoming ‘metaverse' project.
“We need partners who share our vision as we reimagine entertainment and play. Our partnership with Sony and KIRKBI has found this,” said Epic Games CEO Tim Sweeney. A new metaverse will be built where players can have fun with friends and brands create creative and immersive experiences, as well as creators thrive.
Last week, LEGO and Epic Games announced their plans to create a family-friendly metaverse where kids can play, interact, and create in digital environments. The service's users' safety and security will be prioritized.
With this new round of funding, Epic Games' project is now valued at $32 billion.
“Epic Games is known for empowering creators large and small,” said KIRKBI CEO Sren Thorup Srensen. “We invest in trends that we believe will impact the world we and our children will live in. We are pleased to invest in Epic Games to support their continued growth journey, with a long-term focus on the future metaverse.”
Epic Games is expected to unveil its metaverse plans later this year, including its name, details, services, and release date.