


17 Google Secrets 99 Percent of People Don't Know
What can't Google do?
Seriously, nothing! Google rocks.
Google is a major player in online tools and services. We use it for everything, from research to entertainment.
Did I say entertain yourself?
Yes, with so many features and options, it can be difficult to fully utilize Google.
#1. Drive Google Mad
You can make Google's homepage dance if you want to be silly.
Just type “Google Gravity” into Google.com. Then select I'm lucky.
See the page unstick before your eyes!
#2 Play With Google Image
Google isn't just for work.
Then have fun with it!
You can play games right in your search results. When you need a break, google “Solitaire” or “Tic Tac Toe”.
#3. Do a Barrel Roll
Need a little more excitement in your life? Want to see Google dance?
Type “Do a barrel roll” into the Google search bar.
Then relax and watch your screen do a 360.
#4 No Internet? No issue!
This is a fun trick to use when you have no internet.
If your browser shows a “No Internet” page, simply press Space.
Boom!
We have dinosaurs! Now use arrow keys to save your pixelated T-Rex from extinction.
#5 Google Can Help
Play this Google coin flip game to see if you're lucky.
Enter “Flip a coin” into the search engine.
You'll see a coin flipping animation. If you get heads or tails, click it.
#6. Think with Google
My favorite Google find so far is the “Think with Google” website.
Think with Google is a website that offers marketing insights, research, and case studies.
I highly recommend it to entrepreneurs, small business owners, and anyone interested in online marketing.
#7. Google Can Read Images!
This is a cool Google trick that few know about.
You can search for images by keyword or upload your own by clicking the camera icon on Google Images.
Google will then show you all of its similar images.
Caution: You should be fine with your uploaded images being public.
#8. Modify the Google Logo!
Clicking on the “I'm Feeling Lucky” button on Google.com takes you to a random Google Doodle.
Each year, Google creates a Doodle to commemorate holidays, anniversaries, and other occasions.
#9. What is my IP?
Simply type “What is my IP” into Google to find out.
Your IP address will appear on the results page.
#10. Send a Self-Destructing Email With Gmail,
Create a new message in Gmail. Find an icon that resembles a lock and a clock near the SEND button. That's where the Confidential Mode is.
By clicking it, you can set an expiration date for your email. Expiring emails are automatically deleted from both your and the recipient's inbox.
#11. Blink, Google Blink!
This is a unique Google trick.
Type “blink HTML” into Google. The words “blink HTML” will appear and then disappear.
The text is displayed for a split second before being deleted.
To make this work, Google reads the HTML code and executes the “blink” command.
#12. The Answer To Everything
This is for all Douglas Adams fans.
The answer to life, the universe, and everything is 42, according to Google.
An allusion to Douglas Adams' Hitchhiker's Guide to the Galaxy, in which Ford Prefect seeks to understand life, the universe, and everything.
#13. Google in 1998
It's a blast!
Type “Google in 1998” into Google. "I'm feeling lucky"
You'll be taken to an old-school Google homepage.
It's a nostalgic trip for long-time Google users.
#14. Scholarships and Internships
Google can help you find college funding!
Type “scholarships” or “internships” into Google.
The number of results will surprise you.
#15. OK, Google. Dice!
To roll a die, simply type “Roll a die” into Google.
On the results page is a virtual dice that you can click to roll.
#16. Google has secret codes!
Hit the nine squares on the right side of your Google homepage to go to My Account. Then Personal Info.
You can add your favorite language to the “General preferences for the web” tab.
#17. Google Terminal
You can feel like a true hacker.
Just type “Google Terminal” into Google.com. "I'm feeling lucky"
Voila~!
You'll be taken to an old-school computer terminal-style page.
You can then type commands to see what happens.
Have you tried any of these activities? Tell me in the comments.
Read full article here
More on Productivity

Jano le Roux
3 years ago
My Top 11 Tools For Building A Modern Startup, With A Free Plan
The best free tools are probably unknown to you.
Modern startups are easy to build.
Start with free tools.
Let’s go.
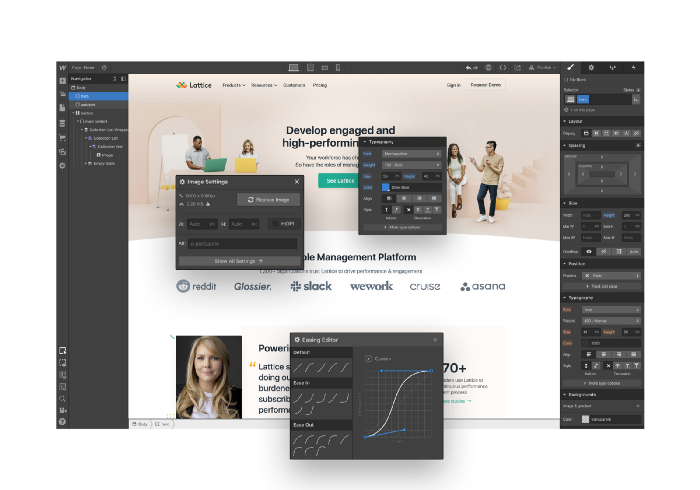
Web development — Webflow
Code-free HTML, CSS, and JS.
Webflow isn't like Squarespace, Wix, or Shopify.
It's a super-fast no-code tool for professionals to construct complex, highly-responsive websites and landing pages.
Webflow can help you add animations like those on Apple's website to your own site.
I made the jump from WordPress a few years ago and it changed my life.
No damn plugins. No damn errors. No damn updates.
The best, you can get started on Webflow for free.
Data tracking — Airtable
Spreadsheet wings.
Airtable combines spreadsheet flexibility with database power without code.
Airtable is modern.
Airtable has modularity.
Scaling Airtable is simple.
Airtable, one of the most adaptable solutions on this list, is perfect for client data management.
Clients choose customized service packages. Airtable consolidates data so you can automate procedures like invoice management and focus on your strengths.
Airtable connects with so many tools that rarely creates headaches. Airtable scales when you do.
Airtable's flexibility makes it a potential backend database.
Design — Figma
Better, faster, easier user interface design.
Figma rocks!
It’s fast.
It's free.
It's adaptable
First, design in Figma.
Iterate.
Export development assets.
Figma lets you add more team members as your company grows to work on each iteration simultaneously.
Figma is web-based, so you don't need a powerful PC or Mac to start.
Task management — Trello
Unclock jobs.
Tacky and terrifying task management products abound. Trello isn’t.
Those that follow Marie Kondo will appreciate Trello.
Everything is clean.
Nothing is complicated.
Everything has a place.
Compared to other task management solutions, Trello is limited. And that’s good. Too many buttons lead to too many decisions lead to too many hours wasted.
Trello is a must for teamwork.
Domain email — Zoho
Free domain email hosting.
Professional email is essential for startups. People relied on monthly payments for too long. Nope.
Zoho offers 5 free professional emails.
It doesn't have Google's UI, but it works.
VPN — Proton VPN
Fast Swiss VPN protects your data and privacy.
Proton VPN is secure.
Proton doesn't record any data.
Proton is based in Switzerland.
Swiss privacy regulation is among the most strict in the world, therefore user data are protected. Switzerland isn't a 14 eye country.
Journalists and activists trust Proton to secure their identities while accessing and sharing information authoritarian governments don't want them to access.
Web host — Netlify
Free fast web hosting.
Netlify is a scalable platform that combines your favorite tools and APIs to develop high-performance sites, stores, and apps through GitHub.
Serverless functions and environment variables preserve API keys.
Netlify's free tier is unmissable.
100GB of free monthly bandwidth.
Free 125k serverless operations per website each month.
Database — MongoDB
Create a fast, scalable database.
MongoDB is for small and large databases. It's a fast and inexpensive database.
Free for the first million reads.
Then, for each million reads, you must pay $0.10.
MongoDB's free plan has:
Encryption from end to end
Continual authentication
field-level client-side encryption
If you have a large database, you can easily connect MongoDB to Webflow to bypass CMS limits.
Automation — Zapier
Time-saving tip: automate repetitive chores.
Zapier simplifies life.
Zapier syncs and connects your favorite apps to do impossibly awesome things.
If your online store is connected to Zapier, a customer's purchase can trigger a number of automated actions, such as:
The customer is being added to an email chain.
Put the information in your Airtable.
Send a pre-programmed postcard to the customer.
Alexa, set the color of your smart lights to purple.
Zapier scales when you do.
Email & SMS marketing — Omnisend
Email and SMS marketing campaigns.
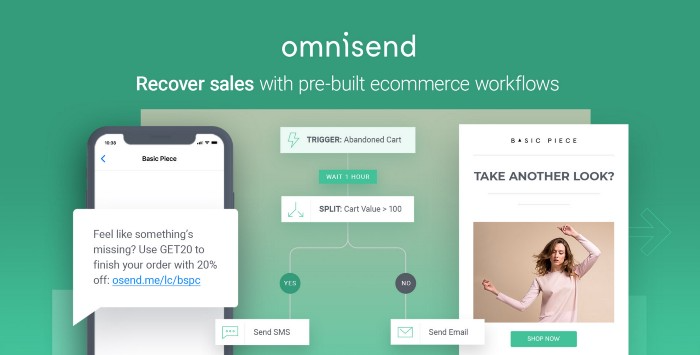
This is an excellent Mailchimp option for magical emails. Omnisend's processes simplify email automation.
I love the interface's cleanliness.
Omnisend's free tier includes web push notifications.
Send up to:
500 emails per month
60 maximum SMSs
500 Web Push Maximum
Forms and surveys — Tally
Create flexible forms that people enjoy.
Typeform is clean but restricting. Sometimes you need to add many questions. Tally's needed sometimes.
Tally is flexible and cheaper than Typeform.
99% of Tally's features are free and unrestricted, including:
Unlimited forms
Countless submissions
Collect payments
File upload
Tally lets you examine what individuals contributed to forms before submitting them to see where they get stuck.
Airtable and Zapier connectors automate things further. If you pay, you can apply custom CSS to fit your brand.
See.
Free tools are the greatest.
Let's use them to launch a startup.

Recep İnanç
3 years ago
Effective Technical Book Reading Techniques

Technical books aren't like novels. We need a new approach to technical texts. I've spent years looking for a decent reading method. I tried numerous ways before finding one that worked. This post explains how I read technical books efficiently.
What Do I Mean When I Say Effective?
Effectiveness depends on the book. Effective implies I know where to find answers after reading a reference book. Effective implies I learned the book's knowledge after reading it.
I use reference books as tools in my toolkit. I won't carry all my tools; I'll merely need them. Non-reference books teach me techniques. I never have to make an effort to use them since I always have them.
Reference books I like:
Design Patterns: Elements of Reusable Object-Oriented Software
Refactoring: Improving the Design of Existing Code
You can also check My Top Takeaways from Refactoring here.
Non-reference books I like:
The Approach
Technical books might be overwhelming to read in one sitting. Especially when you have no idea what is coming next as you read. When you don't know how deep the rabbit hole goes, you feel lost as you read. This is my years-long method for overcoming this difficulty.
Whether you follow the step-by-step guide or not, remember these:
Understand the terminology. Make sure you get the meaning of any terms you come across more than once. The likelihood that a term will be significant increases as you encounter it more frequently.
Know when to stop. I've always believed that in order to truly comprehend something, I must delve as deeply as possible into it. That, however, is not usually very effective. There are moments when you have to draw the line and start putting theory into practice (if applicable).
Look over your notes. When reading technical books or documents, taking notes is a crucial habit to develop. Additionally, you must regularly examine your notes if you want to get the most out of them. This will assist you in internalizing the lessons you acquired from the book. And you'll see that the urge to review reduces with time.
Let's talk about how I read a technical book step by step.
0. Read the Foreword/Preface
These sections are crucial in technical books. They answer Who should read it, What each chapter discusses, and sometimes How to Read? This is helpful before reading the book. Who could know the ideal way to read the book better than the author, right?
1. Scanning
I scan the chapter. Fast scanning is needed.
I review the headings.
I scan the pictures quickly.
I assess the chapter's length to determine whether I might divide it into more manageable sections.
2. Skimming
Skimming is faster than reading but slower than scanning.
I focus more on the captions and subtitles for the photographs.
I read each paragraph's opening and closing sentences.
I examined the code samples.
I attempt to grasp each section's basic points without getting bogged down in the specifics.
Throughout the entire reading period, I make an effort to make mental notes of what may require additional attention and what may not. Because I don't want to spend time taking physical notes, kindly notice that I am using the term "mental" here. It is much simpler to recall. You may think that this is more significant than typing or writing “Pay attention to X.”
I move on quickly. This is something I considered crucial because, when trying to skim, it is simple to start reading the entire thing.
3. Complete reading
Previous steps pay off.
I finished reading the chapter.
I concentrate on the passages that I mentally underlined when skimming.
I put the book away and make my own notes. It is typically more difficult than it seems for me. But it's important to speak in your own words. You must choose the right words to adequately summarize what you have read. How do those words make you feel? Additionally, you must be able to summarize your notes while you are taking them. Sometimes as I'm writing my notes, I realize I have no words to convey what I'm thinking or, even worse, I start to doubt what I'm writing down. This is a good indication that I haven't internalized that idea thoroughly enough.
I jot my inquiries down. Normally, I read on while compiling my questions in the hopes that I will learn the answers as I read. I'll explore those issues more if I wasn't able to find the answers to my inquiries while reading the book.
Bonus!
Best part: If you take lovely notes like I do, you can publish them as a blog post with a few tweaks.
Conclusion
This is my learning journey. I wanted to show you. This post may help someone with a similar learning style. You can alter the principles above for any technical material.

Ethan Siegel
3 years ago
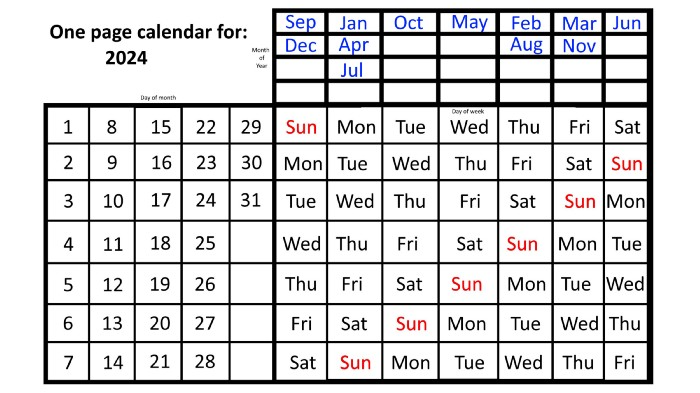
How you view the year will change after using this one-page calendar.
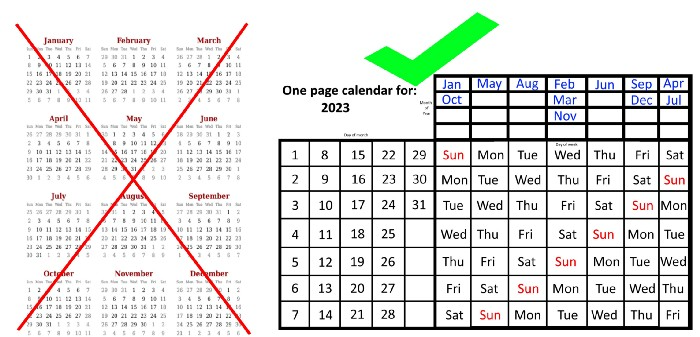
No other calendar is simpler, smaller, and reusable year after year. It works and is used here.
Most of us discard and replace our calendars annually. Each month, we move our calendar ahead another page, thus if we need to know which day of the week corresponds to a given day/month combination, we have to calculate it or flip forward/backward to the corresponding month. Questions like:
What day does this year's American Thanksgiving fall on?
Which months contain a Friday the thirteenth?
When is July 4th? What day of the week?
Alternatively, what day of the week is Christmas?
They're hard to figure out until you switch to the right month or look up all the months.
However, mathematically, the answers to these questions or any question that requires matching the day of the week with the day/month combination in a year are predictable, basic, and easy to work out. If you use this one-page calendar instead of a 12-month calendar, it lasts the whole year and is easy to alter for future years. Let me explain.
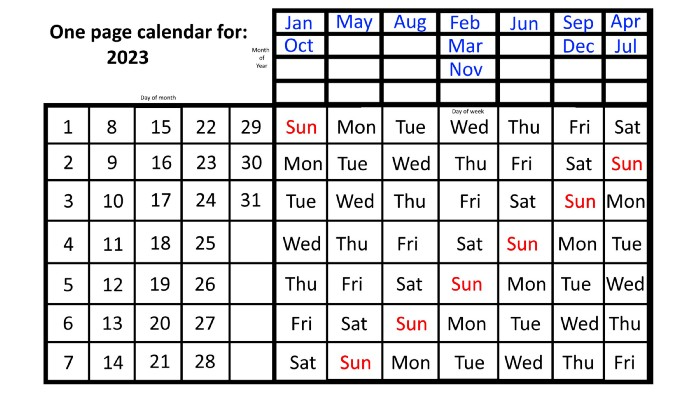
The 2023 one-page calendar is above. The days of the month are on the lower left, which works for all months if you know that:
There are 31 days in January, March, May, July, August, October, and December.
All of the months of April, June, September, and November have 30 days.
And depending on the year, February has either 28 days (in non-leap years) or 29 days (in leap years).
If you know this, this calendar makes it easy to match the day/month of the year to the weekday.
Here are some instances. American Thanksgiving is always on the fourth Thursday of November. You'll always know the month and day of the week, but the date—the day in November—changes each year.
On any other calendar, you'd have to flip to November to see when the fourth Thursday is. This one-page calendar only requires:
pick the month of November in the top-right corner to begin.
drag your finger down until Thursday appears,
then turn left and follow the monthly calendar until you reach the fourth Thursday.
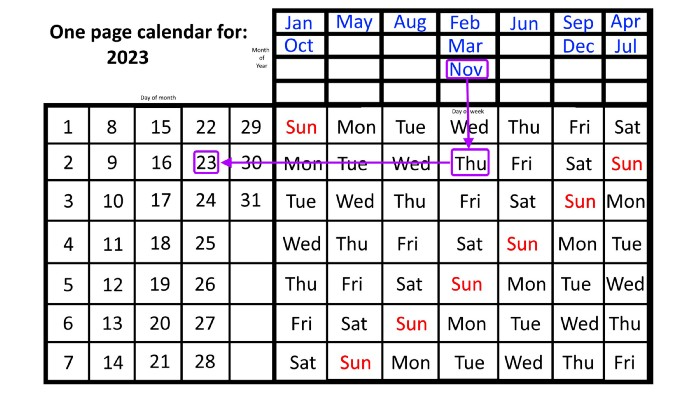
It's obvious: 2023 is the 23rd American Thanksgiving. For every month and day-of-the-week combination, start at the month, drag your finger down to the desired day, and then move to the left to see which dates match.
What if you knew the day of the week and the date of the month, but not the month(s)?
A different method using the same one-page calendar gives the answer. Which months have Friday the 13th this year? Just:
begin on the 13th of the month, the day you know you desire,
then swipe right with your finger till Friday appears.
and then work your way up until you can determine which months the specific Friday the 13th falls under.
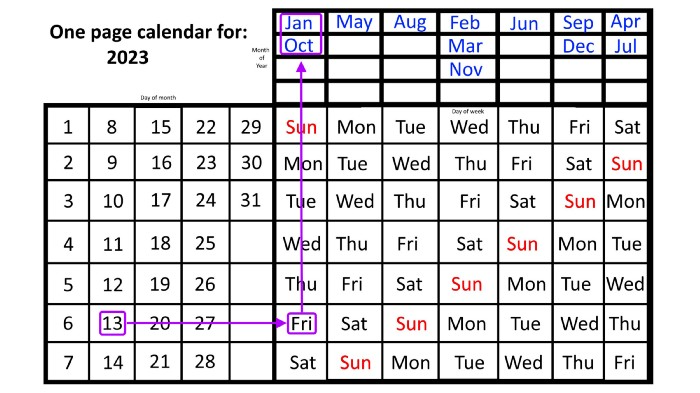
One Friday the 13th occurred in January 2023, and another will occur in October.
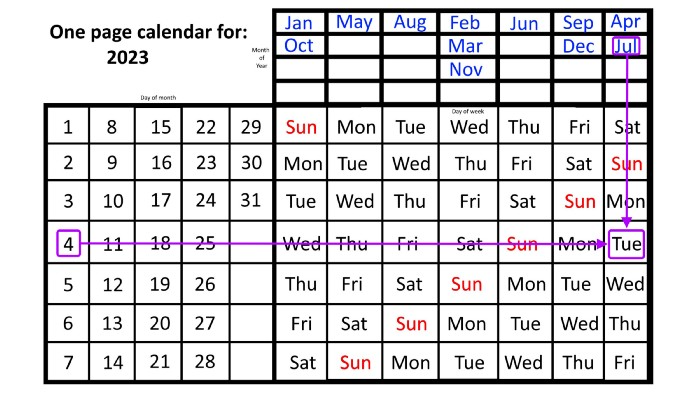
The most typical reason to consult a calendar is when you know the month/day combination but not the day of the week.
Compared to single-month calendars, the one-page calendar excels here. Take July 4th, for instance. Find the weekday here:
beginning on the left on the fourth of the month, as you are aware,
also begin with July, the month of the year you are most familiar with, at the upper right,
you should move your two fingers in the opposite directions till they meet: on a Tuesday in 2023.
That's how you find your selected day/month combination's weekday.
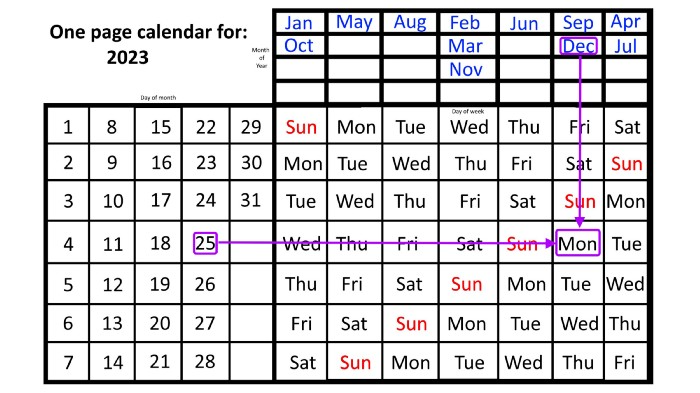
Another example: Christmas. Christmas Day is always December 25th, however unless your conventional calendar is open to December of your particular year, a question like "what day of the week is Christmas?" difficult to answer.
Unlike the one-page calendar!
Remember the left-hand day of the month. Top-right, you see the month. Put two fingers, one from each hand, on the date (25th) and the month (December). Slide the day hand to the right and the month hand downwards until they touch.
They meet on Monday—December 25, 2023.
For 2023, that's fine, but what happens in 2024? Even worse, what if we want to know the day-of-the-week/day/month combo many years from now?
I think the one-page calendar shines here.
Except for the blue months in the upper-right corner of the one-page calendar, everything is the same year after year. The months also change in a consistent fashion.
Each non-leap year has 365 days—one more than a full 52 weeks (which is 364). Since January 1, 2023 began on a Sunday and 2023 has 365 days, we immediately know that December 31, 2023 will conclude on a Sunday (which you can confirm using the one-page calendar) and that January 1, 2024 will begin on a Monday. Then, reorder the months for 2024, taking in mind that February will have 29 days in a leap year.
Please note the differences between 2023 and 2024 month placement. In 2023:
October and January began on the same day of the week.
On the following Monday of the week, May began.
August started on the next day,
then the next weekday marked the start of February, March, and November, respectively.
Unlike June, which starts the following weekday,
While September and December start on the following day of the week,
Lastly, April and July start one extra day later.
Since 2024 is a leap year, February has 29 days, disrupting the rhythm. Month placements change to:
The first day of the week in January, April, and July is the same.
October will begin the following day.
Possibly starting the next weekday,
February and August start on the next weekday,
beginning on the following day of the week between March and November,
beginning the following weekday in June,
and commencing one more day of the week after that, September and December.
Due to the 366-day leap year, 2025 will start two days later than 2024 on January 1st.
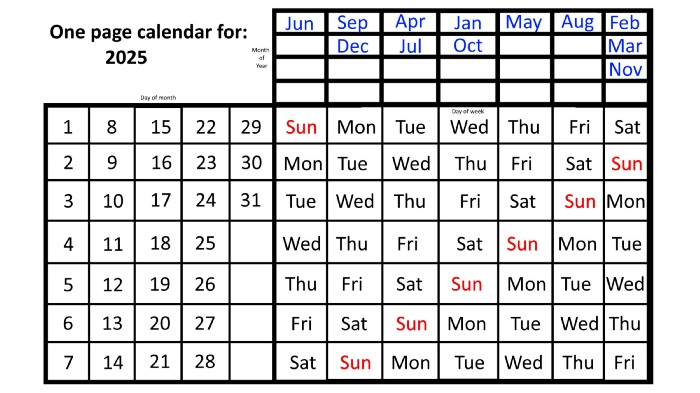
Now, looking at the 2025 calendar, you can see that the 2023 pattern of which months start on which days is repeated! The sole variation is a shift of three days-of-the-week ahead because 2023 had one more day (365) than 52 full weeks (364), and 2024 had two more days (366). Again,
On Wednesday this time, January and October begin on the same day of the week.
Although May begins on Thursday,
August begins this Friday.
March, November, and February all begin on a Saturday.
Beginning on a Sunday in June
Beginning on Monday are September and December,
and on Tuesday, April and July begin.
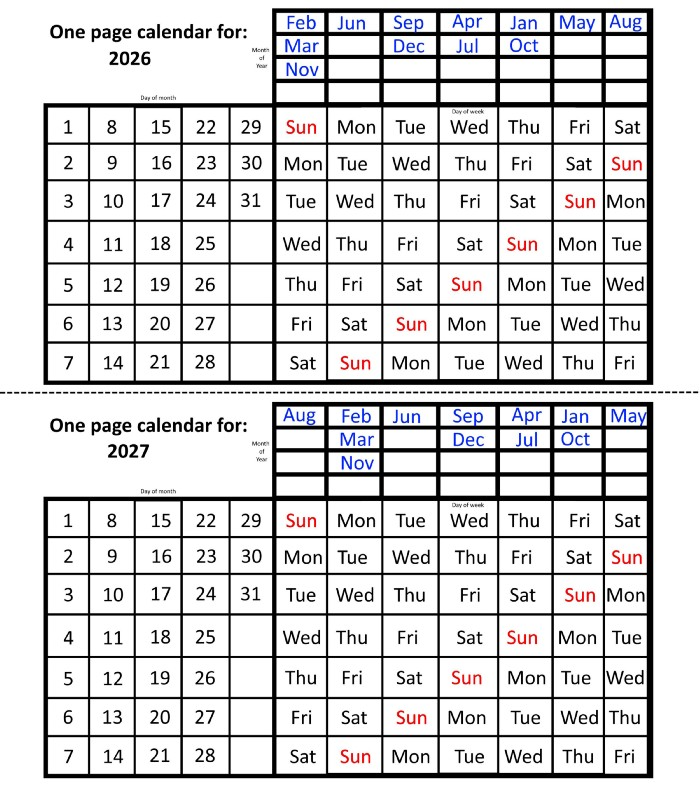
In 2026 and 2027, the year will commence on a Thursday and a Friday, respectively.
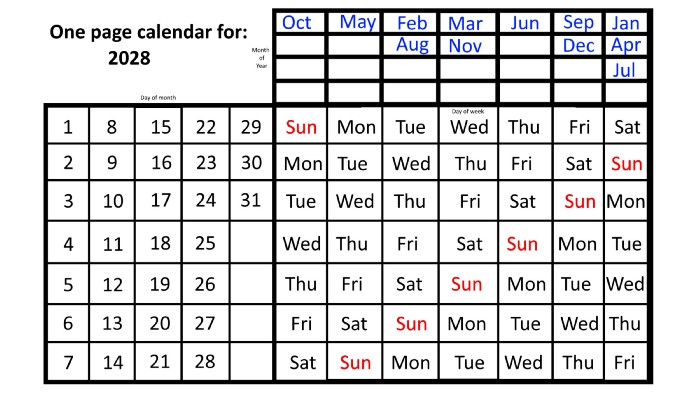
We must return to our leap year monthly arrangement in 2028. Yes, January 1, 2028 begins on a Saturday, but February, which begins on a Tuesday three days before January, will have 29 days. Thus:
Start dates for January, April, and July are all Saturdays.
Given that October began on Sunday,
Although May starts on a Monday,
beginning on a Tuesday in February and August,
Beginning on a Wednesday in March and November,
Beginning on Thursday, June
and Friday marks the start of September and December.
This is great because there are only 14 calendar configurations: one for each of the seven non-leap years where January 1st begins on each of the seven days of the week, and one for each of the seven leap years where it begins on each day of the week.
The 2023 calendar will function in 2034, 2045, 2051, 2062, 2073, 2079, 2090, 2102, 2113, and 2119. Except when passing over a non-leap year that ends in 00, like 2100, the repeat time always extends to 12 years or shortens to an extra 6 years.
The pattern is repeated in 2025's calendar in 2031, 2042, 2053, 2059, 2070, 2081, 2087, 2098, 2110, and 2121.
The extra 6-year repeat at the end of the century on the calendar for 2026 will occur in the years 2037, 2043, 2054, 2065, 2071, 2082, 2093, 2099, 2105, and 2122.
The 2027s calendar repeats in 2038, 2049, 2055, 2066, 2077, 2083, 2094, 2100, 2106, and 2117, almost exactly matching the 2026s pattern.
For leap years, the recurrence pattern is every 28 years when not passing a non-leap year ending in 00, or 12 or 40 years when we do. 2024's calendar repeats in 2052, 2080, 2120, 2148, 2176, and 2216; 2028's in 2056, 2084, 2124, 2152, 2180, and 2220.
Knowing January 1st and whether it's a leap year lets you construct a one-page calendar for any year. Try it—you might find it easier than any other alternative!
You might also like

Bastian Hasslinger
3 years ago
Before 2021, most startups had excessive valuations. It is currently causing issues.

Higher startup valuations are often favorable for all parties. High valuations show a business's potential. New customers and talent are attracted. They earn respect.
Everyone benefits if a company's valuation rises.
Founders and investors have always been incentivized to overestimate a company's value.
Post-money valuations were inflated by 2021 market expectations and the valuation model's mechanisms.
Founders must understand both levers to handle a normalizing market.
2021, the year of miracles
2021 must've seemed miraculous to entrepreneurs, employees, and VCs. Valuations rose, and funding resumed after the first Covid-19 epidemic caution.
In 2021, VC investments increased from $335B to $643B. 518 new worldwide unicorns vs. 134 in 2020; 951 US IPOs vs. 431.
Things can change quickly, as 2020-21 showed.
Rising interest rates, geopolitical developments, and normalizing technology conditions drive down share prices and tech company market caps in 2022. Zoom, the poster-child of early lockdown success, is down 37% since 1st Jan.
Once-inflated valuations can become a problem in a normalizing market, especially for founders, employees, and early investors.
the reason why startups are always overvalued
To see why inflated valuations are a problem, consider one of its causes.
Private company values only fluctuate following a new investment round, unlike publicly-traded corporations. The startup's new value is calculated simply:
(Latest round share price) x (total number of company shares)
This is the industry standard Post-Money Valuation model.
Let’s illustrate how it works with an example. If a VC invests $10M for 1M shares (at $10/share), and the company has 10M shares after the round, its Post-Money Valuation is $100M (10/share x 10M shares).
This approach might seem like the most natural way to assess a business, but the model often unintentionally overstates the underlying value of the company even if the share price paid by the investor is fair. All shares aren't equal.
New investors in a corporation will always try to minimize their downside risk, or the amount they lose if things go wrong. New investors will try to negotiate better terms and pay a premium.
How the value of a struggling SpaceX increased
SpaceX's 2008 Series D is an example. Despite the financial crisis and unsuccessful rocket launches, the company's Post-Money Valuation was 36% higher after the investment round. Why?
Series D SpaceX shares were protected. In case of liquidation, Series D investors were guaranteed a 2x return before other shareholders.
Due to downside protection, investors were willing to pay a higher price for this new share class.
The Post-Money Valuation model overpriced SpaceX because it viewed all the shares as equal (they weren't).
Why entrepreneurs, workers, and early investors stand to lose the most
Post-Money Valuation is an effective and sufficient method for assessing a startup's valuation, despite not taking share class disparities into consideration.
In a robust market, where the firm valuation will certainly expand with the next fundraising round or exit, the inflated value is of little significance.
Fairness endures. If a corporation leaves at a greater valuation, each stakeholder will receive a proportional distribution. (i.e., 5% of a $100M corporation yields $5M).
SpaceX's inherent overvaluation was never a problem. Had it been sold for less than its Post-Money Valuation, some shareholders, including founders, staff, and early investors, would have seen their ownership drop.
The unforgiving world of 2022
In 2022, founders, employees, and investors who benefited from inflated values will face below-valuation exits and down-rounds.
For them, 2021 will be a curse, not a blessing.
Some tech giants are worried. Klarna's valuation fell from $45B (Oct 21) to $30B (Jun 22), Canvas from $40B to $27B, and GoPuffs from $17B to $8.3B.
Shazam and Blue Apron have to exit or IPO at a cheaper price. Premium share classes are protected, while others receive less. The same goes for bankrupts.
Those who continue at lower valuations will lose reputation and talent. When their value declines by half, generous employee stock options become less enticing, and their ability to return anything is questioned.
What can we infer about the present situation?
Such techniques to enhance your company's value or stop a normalizing market are fiction.
The current situation is a painful reminder for entrepreneurs and a crucial lesson for future firms.
The devastating market fall of the previous six months has taught us one thing:
Keep in mind that any valuation is speculative. Money Post A startup's valuation is a highly simplified approximation of its true value, particularly in the early phases when it lacks significant income or a cutting-edge product. It is merely a projection of the future and a hypothetical meter. Until it is achieved by an exit, a valuation is nothing more than a number on paper.
Assume the value of your company is lower than it was in the past. Your previous valuation might not be accurate now due to substantial changes in the startup financing markets. There is little reason to think that your company's value will remain the same given the 50%+ decline in many newly listed IT companies. Recognize how the market situation is changing and use caution.
Recognize the importance of the stake you hold. Each share class has a unique value that varies. Know the sort of share class you own and how additional contractual provisions affect the market value of your security. Frameworks have been provided by Metrick and Yasuda (Yale & UC) and Gornall and Strebulaev (Stanford) for comprehending the terms that affect investors' cash-flow rights upon withdrawal. As a result, you will be able to more accurately evaluate your firm and determine the worth of each share class.
Be wary of approving excessively protective share terms.
The trade-offs should be considered while negotiating subsequent rounds. Accepting punitive contractual terms could first seem like a smart option in order to uphold your inflated worth, but you should proceed with caution. Such provisions ALWAYS result in misaligned shareholders, with common shareholders (such as you and your staff) at the bottom of the list.

Tom Smykowski
3 years ago
CSS Scroll-linked Animations Will Transform The Web's User Experience
We may never tap again in ten years.
I discussed styling websites and web apps on smartwatches in my earlier article on W3C standardization.
The Parallax Chronicles
Section containing examples and flying objects
Another intriguing Working Draft I found applies to all devices, including smartphones.
These pages may have something intriguing. Take your time. Return after scrolling:
What connects these three pages?
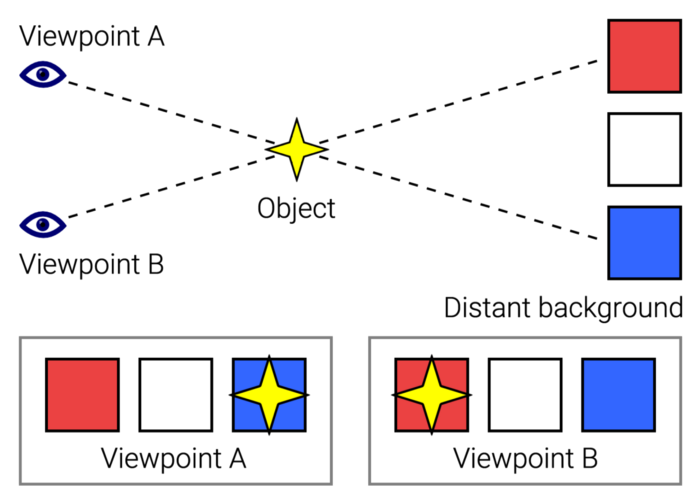
JustinWick at English Wikipedia • CC-BY-SA-3.0
Scroll-linked animation, commonly called parallax, is the effect.
WordPress theme developers' quick setup and low-code tools made the effect popular around 2014.
Parallax: Why Designers Love It
The chapter that your designer shouldn't read
Online video playback required searching, scrolling, and clicking ten years ago. Scroll and click four years ago.
Some video sites let you swipe to autoplay the next video from an endless list.
UI designers create scrollable pages and apps to accommodate the behavioral change.
Web interactivity used to be mouse-based. Clicking a button opened a help drawer, and hovering animated it.
However, a large page with more material requires fewer buttons and less interactiveness.
Designers choose scroll-based effects. Design and frontend developers must fight the trend but prepare for the worst.
How to Create Parallax
The component that you might want to show the designer
JavaScript-based effects track page scrolling and apply animations.
Javascript libraries like lax.js simplify it.
Using it needs a lot of human mathematical and physical computations.
Your asset library must also be prepared to display your website on a laptop, television, smartphone, tablet, foldable smartphone, and possibly even a microwave.
Overall, scroll-based animations can be solved better.
CSS Scroll-linked Animations
CSS makes sense since it's presentational. A Working Draft has been laying the groundwork for the next generation of interactiveness.
The new CSS property scroll-timeline powers the feature, which MDN describes well.
Before testing it, you should realize it is poorly supported:
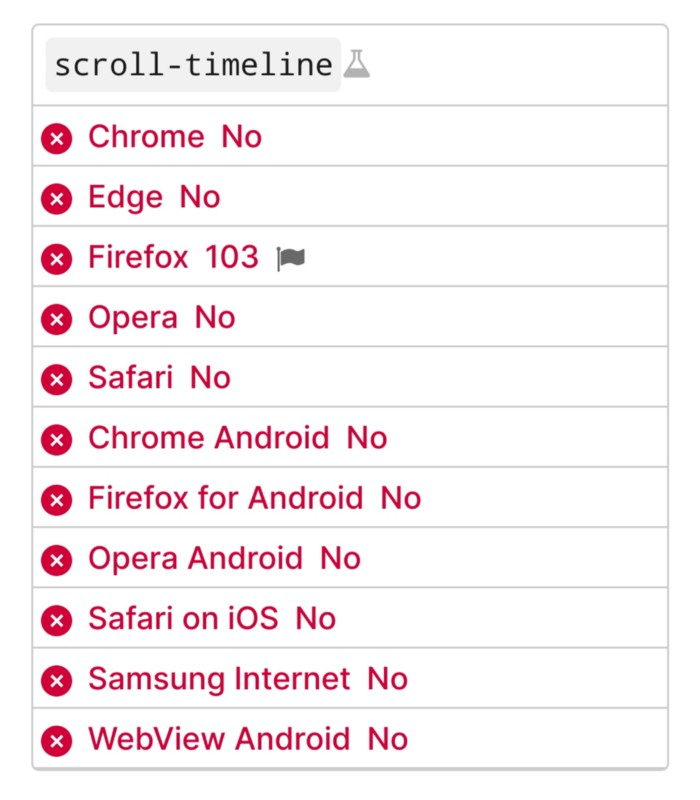
Firefox 103 currently supports it.
There is also a polyfill, with some demo examples to explore.
Summary
Web design was a protracted process. Started with pages with static backdrop images and scrollable text. Artists and designers may use the scroll-based animation CSS API to completely revamp our web experience.
It's a promising frontier. This post may attract a future scrollable web designer.
Ps. I have created flashcards for HTML, Javascript etc. Check them out!

Akshad Singi
3 years ago
Four obnoxious one-minute habits that help me save more than 30 hours each week
These four, when combined, destroy procrastination.

You're not rushed. You waste it on busywork.
You'll accept this eventually.
In 2022, the daily average usage of a user on social media is 2.5 hours.
By 2020, 6 billion hours of video were watched each month by Netflix's customers, who used the service an average of 3.2 hours per day.
When we see these numbers, we think "Wow!" People squander so much time as though they don't contribute. True. These are yours. Likewise.
We don't lack time; we just waste it. Once you realize this, you can change your habits to save time. This article explains. If you adopt ALL 4 of these simple behaviors, you'll see amazing benefits.
Time-blocking
Cal Newport's time-blocking trick takes a minute but improves your day's clarity.
Divide the next day into 30-minute (or 5-minute, if you're Elon Musk) segments and assign responsibilities. As seen.
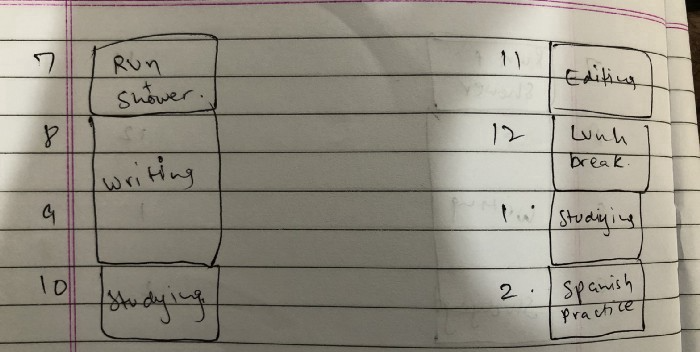
Here's why:
The procrastination that results from attempting to determine when to begin working is eliminated. Procrastination is a given if you choose when to begin working in real-time. Even if you may assume you'll start working in five minutes, it won't take you long to realize that five minutes have turned into an hour. But if you've already determined to start working at 2:00 the next day, your odds of procrastinating are greatly decreased, if not eliminated altogether.
You'll also see that you have a lot of time in a day when you plan your day out on paper and assign chores to each hour. Doing this daily will permanently eliminate the lack of time mindset.
5-4-3-2-1: Have breakfast with the frog!
“If it’s your job to eat a frog, it’s best to do it first thing in the morning. And If it’s your job to eat two frogs, it’s best to eat the biggest one first.”
Eating the frog means accomplishing the day's most difficult chore. It's better to schedule it first thing in the morning when time-blocking the night before. Why?
The day's most difficult task is also the one that causes the most postponement. Because of the stress it causes, the later you schedule it, the more time you risk wasting by procrastinating.
However, if you do it right away in the morning, you'll feel good all day. This is the reason it was set for the morning.
Mel Robbins' 5-second rule can help. Start counting backward 54321 and force yourself to start at 1. If you acquire the urge to work on a goal, you must act within 5 seconds or your brain will destroy it. If you're scheduled to eat your frog at 9, eat it at 8:59. Start working.
Micro-visualisation
You've heard of visualizing to enhance the future. Visualizing a bright future won't do much if you're not prepared to focus on the now and develop the necessary habits. Alexander said:
People don’t decide their futures. They decide their habits and their habits decide their future.
I visualize the next day's schedule every morning. My day looks like this
“I’ll start writing an article at 7:30 AM. Then, I’ll get dressed up and reach the medicine outpatient department by 9:30 AM. After my duty is over, I’ll have lunch at 2 PM, followed by a nap at 3 PM. Then, I’ll go to the gym at 4…”
etc.
This reinforces the day you planned the night before. This makes following your plan easy.
Set the timer.
It's the best iPhone productivity app. A timer is incredible for increasing productivity.
Set a timer for an hour or 40 minutes before starting work. Your call. I don't believe in techniques like the Pomodoro because I can focus for varied amounts of time depending on the time of day, how fatigued I am, and how cognitively demanding the activity is.
I work with a timer. A timer keeps you focused and prevents distractions. Your mind stays concentrated because of the timer. Timers generate accountability.
To pee, I'll pause my timer. When I sit down, I'll continue. Same goes for bottle refills. To use Twitter, I must pause the timer. This creates accountability and focuses work.
Connecting everything
If you do all 4, you won't be disappointed. Here's how:
Plan out your day's schedule the night before.
Next, envision in your mind's eye the same timetable in the morning.
Speak aloud 54321 when it's time to work: Eat the frog! In the morning, devour the largest frog.
Then set a timer to ensure that you remain focused on the task at hand.