

More on Productivity

Asher Umerie
4 years ago
What is Bionic Reading?
Senses help us navigate a complicated world. They shape our worldview - how we hear, smell, feel, and taste. People claim a sixth sense, an intuitive capacity that extends perception.
Our brain is a half-pool of grey and white matter that stores data from our senses. Brains provide us context, so zombies' obsession makes sense.
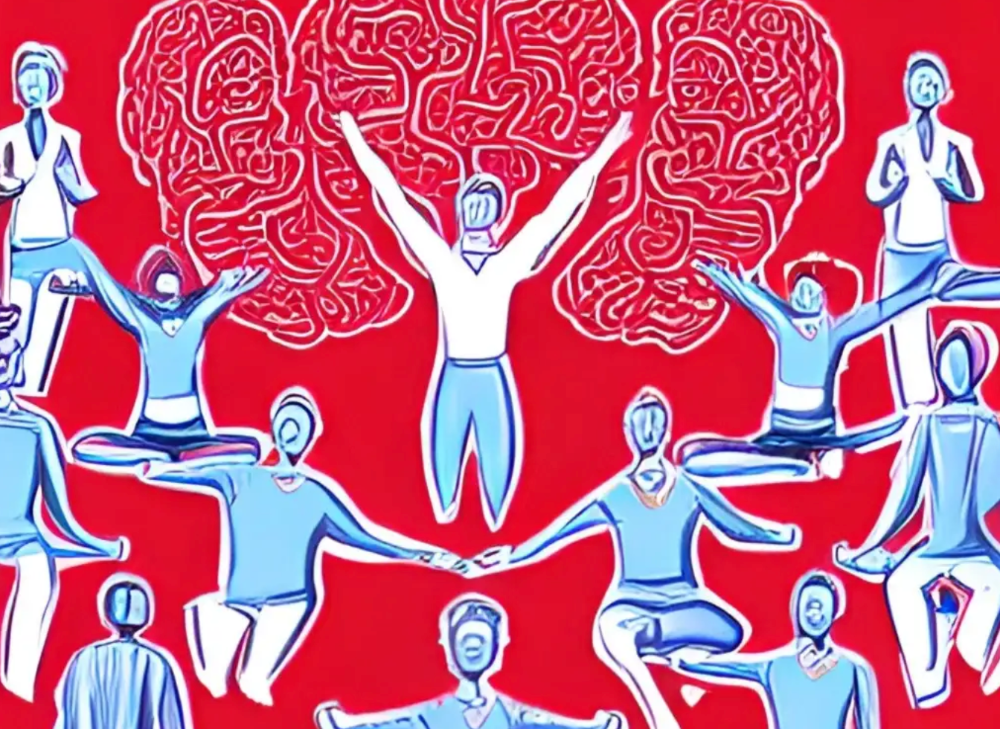
Bionic reading uses the brain's visual information and context to simplify text comprehension.
Stay with me.
What is Bionic Reading?
Bionic reading is a software application established by Swiss typographic designer Renato Casutt. The term honors the brain (bio) and technology's collaboration to better text comprehension.
The image above shows two similar paragraphs with bionic reading.
Notice anything yet?
This Twitter user did.
I did too...
Image text describes bionic reading-
New method to aid reading by using artificial fixation points. The reader focuses on the highlighted starting letters, and the brain completes the word.
How is Bionic Reading possible?
Do you remember seeing social media posts asking you to stare at a black dot for 30 seconds (or more)? You blink and see an after-image on your wall.
Our brains are skilled at identifying patterns and'seeing' familiar objects, therefore optical illusions are conceivable.
Brain and sight collaborate well. Text comprehension proves it.
Considering evolutionary patterns, humans' understanding skills may be cosmic luck.
Scientists don't know why people can read and write, but they do know what reading does to the brain.
One portion of your brain recognizes words, while another analyzes their meaning. Fixation, saccade, and linguistic transparency/opacity aid.
Let's explain some terms.
-
Fixation is how the eyes move when reading. It's where you look. If the eyes fixate less, a reader can read quicker. [Eye fixation is a physiological process](Eye fixation is a naturally occurring physiological process) impacted by the reader's vocabulary, vision span, and text familiarity.
-
Saccade - Pause and look around. That's a saccade. Rapid eye movements that alter the place of fixation, as reading text or looking around a room. They can happen willingly (when you choose) or instinctively, even when your eyes are fixed.
-
Linguistic transparency and opacity analyze how well a composite word or phrase may be deduced from its constituents.
The Bionic reading website compares these tools.
Text highlights lead the eye. Fixation, saccade, and opacity can transfer visual stimuli to text, changing typeface.
## Final Thoughts on Bionic Reading
I'm excited about how this could influence my long-term assimilation and productivity.
This technology is still in development, with prototypes working on only a few apps. Like any new tech, it will be criticized.
I'll be watching Bionic Reading closely. Comment on it!

Dr Mehmet Yildiz
3 years ago
How I train my brain daily for clarity and productivity.
I use a conceptual and practical system I developed decades ago as an example.
Since childhood, I've been interested in the brain-mind connection, so I developed a system using scientific breakthroughs, experiments, and the experiences of successful people in my circles.
This story provides a high-level overview of a custom system to inform and inspire readers. Creating a mind gym was one of my best personal and professional investments.
Such a complex system may not be possible for everyone or appear luxurious at first. However, the process and approach may help you find more accessible and viable solutions.
Visualizing the brain as a muscle, I learned to stimulate it with physical and mental exercises, applying a new mindset and behavioral changes.
My methods and practices may not work for others because we're all different. I focus on the approach's principles and highlights so you can create your own program.
Some create a conceptual and practical system intuitively, and others intellectually. Both worked. I see intellect and intuition as higher selves.
The mental tools I introduce are based on lifestyle changes and can be personalized by anyone, barring physical constraints or underlying health conditions.
Some people can't meditate despite wanting to due to mental constraints. This story lacks exceptions.
People's systems may vary. Many have used my tools successfully. All have scientific backing because their benefits attracted scientists. None are unethical or controversial.
My focus is cognition, which is the neocortex's ability. These practices and tools can affect the limbic and reptilian brain regions.
A previous article discussed brain health's biological aspects. This article focuses on psychology.
Thinking, learning, and remembering are cognitive abilities. Cognitive abilities determine our health and performance.
Cognitive health is the ability to think, concentrate, learn, and remember. Cognitive performance boosting involves various tools and processes. My system and protocols address cognitive health and performance.
As a biological organ, the brain's abilities decline with age, especially if not used regularly. Older people have more neurodegenerative disorders like dementia.
As aging is inevitable, I focus on creating cognitive reserves to remain mentally functional as we age and face mental decline or cognitive impairment.
My protocols focus on neurogenesis, or brain growth and maintenance. Neurons and connections can grow at any age.
Metacognition refers to knowing our cognitive abilities, like thinking about thinking and learning how to learn.
In the following sections, I provide an overview of my system, mental tools, and protocols.
This system summarizes my 50-year career. Some may find it too abstract, so I give examples.
First, explain the system. Section 2 introduces activities. Third, how to measure and maintain mental growth.
1 — Developed a practical mental gym.
The mental gym is a metaphor for the physical fitness gym to improve our mental muscles.
This concept covers brain and mind functionality. Integrated biological and psychological components.
I'll describe my mental gym so my other points make sense. My mental gym has physical and mental tools.
Mindfulness, meditation, visualization, self-conversations, breathing exercises, expressive writing, working in a flow state, reading, music, dance, isometric training, barefoot walking, cold/heat exposure, CBT, and social engagements are regular tools.
Dancing, walking, and thermogenesis are body-related tools. As the brain is part of the body and houses the mind, these tools can affect mental abilities such as attention, focus, memory, task switching, and problem-solving.
Different people may like different tools. I chose these tools based on my needs, goals, and lifestyle. They're just examples. You can choose tools that fit your goals and personality.
2 — Performed tasks regularly.
These tools gave me clarity. They became daily hobbies. Some I did alone, others with others.
Some examples: I meditate daily. Even though my overactive mind made daily meditation difficult at first, I now enjoy it. Meditation three times a day sharpens my mind.
Self-talk is used for self-therapy and creativity. Self-talk was initially difficult, but neurogenesis rewired my brain to make it a habit.
Cold showers, warm baths with Epsom salts, fasting, barefoot walks on the beach or grass, dancing, calisthenics, trampoline hopping, and breathing exercises increase my mental clarity, creativity, and productivity.
These exercises can increase BDNF, which promotes nervous system growth. They improve mental capacity and performance by increasing blood flow and brain oxygenation.
I use weekly and occasional activities like dry saunas, talking with others, and community activities.
These activities stimulate the brain and mind, improving performance and cognitive capacity.
3 — Measured progress, set growth goals.
Measuring progress helps us stay on track. Without data, it's hard to stay motivated. When we face inevitable setbacks, we may abandon our dreams.
I created a daily checklist for a spreadsheet with macros. I tracked how often and long I did each activity.
I measured my progress objectively and subjectively. In the progress spreadsheet, I noted my meditation hours and subjective feelings.
In another column, I used good, moderate, and excellent to get qualitative data. It took time and effort. Later, I started benefiting from this automated structure.
Creating a page for each activity, such as meditation, self-talk, cold showers, walking, expressive writing, personal interactions, etc., gave me empirical data I could analyze, modify, and graph to show progress.
Colored charts showed each area's strengths and weaknesses.
Strengths motivate me to continue them. Identifying weaknesses helped me improve them.
As the system matured, data recording became a habit and took less time. I saw the result immediately because I automated the charts when I entered daily data. Early time investment paid off later.
Mind Gym Benefits, Effective Use, and Progress Measuring
This concept helped me move from comfort to risk. I accept things as they are.
Turnarounds were made. I stopped feeling "Fight-Flight-Freeze" and maintained self-control.
I tamed my overactive amygdala by strengthening my brain. Stress and anxiety decreased. With these shifts, I accepted criticism and turned envy into admiration. Clarity improved.
When the cognitive part of the brain became stronger and the primitive part was tamed, managing thoughts and emotions became easier. My AQ increased. I learned to tolerate people, physical, mental, and emotional obstacles.
Accessing vast information sources in my subconscious mind through an improved RAS allowed me to easily tap into my higher self and recognize flaws in my lower self.
Summary
The brain loves patterns and routines, so habits help. Observing, developing, and monitoring habits mindfully can be beneficial. Mindfulness helps us achieve this goal systematically.
As body and mind are connected, we must consider both when building habits. Consistent and joyful practices can strengthen neurons and neural connections.
Habits help us accomplish more with less effort. Regularly using mental tools and processes can improve our cognitive health and performance as we age.
Creating daily habits to improve cognitive abilities can sharpen our minds and boost our well-being.
Some apps monitor our activities and behavior to help build habits. If you can't replicate my system, try these apps. Some smartwatches and fitness devices include them.
Set aside time each day for mental activities you enjoy. Regular scheduling and practice can strengthen brain regions and form habits. Once you form habits, tasks become easy.
Improving our minds is a lifelong journey. It's easier and more sustainable to increase our efforts daily, weekly, monthly, or annually.
Despite life's ups and downs, many want to remain calm and cheerful.
This valuable skill is unrelated to wealth or fame. It's about our mindset, fueled by our biological and psychological needs.
Here are some lessons I've learned about staying calm and composed despite challenges and setbacks.
1 — Tranquillity starts with observing thoughts and feelings.
2 — Clear the mental clutter and emotional entanglements with conscious breathing and gentle movements.
3 — Accept situations and events as they are with no resistance.
4 — Self-love can lead to loving others and increasing compassion.
5 — Count your blessings and cultivate gratitude.
Clear thinking can bring joy and satisfaction. It's a privilege to wake up with a healthy body and clear mind, ready to connect with others and serve them.
Thank you for reading my perspectives. I wish you a healthy and happy life.

Jon Brosio
3 years ago
Every time I use this 6-part email sequence, I almost always make four figures.
(And you can have it for free)

Master email to sell anything.
Most novice creators don't know how to begin.
Many use online templates. These are usually fluff-filled and niche-specific.
They're robotic and "salesy."
I've attended 3 courses, read 10 books, and sent 600,000 emails in the past five years.
Outcome?
This *proven* email sequence assures me a month's salary every time I send it.
What you will discover in this article is that:
A full 6-part email sales cycle
The essential elements you must incorporate
placeholders and text-filled images
(Applies to any niche)
This can be a product introduction, holiday, or welcome sequence. This works for email-saleable products.
Let's start
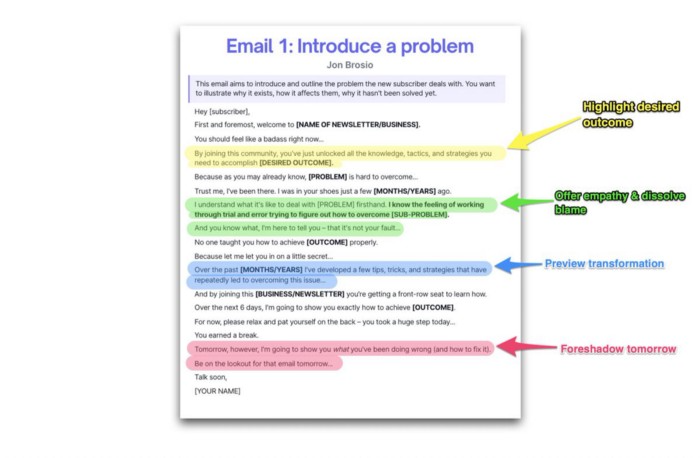
Email 1: Describe your issue
This email is crucial.
How to? We introduce a subscriber or prospect's problem. Later, we'll frame our offer as the solution.
Label the:
Problem
Why it still hasn't been fixed
Resulting implications for the customer
This puts our new subscriber in solve mode and queues our offer:
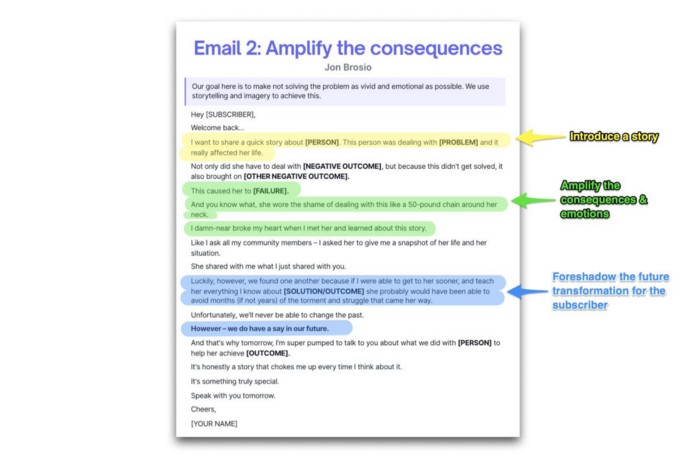
Email 2: Amplify the consequences
We're still causing problems.
We've created the problem, but now we must employ emotion and storytelling to make it real. We also want to forecast life if nothing changes.
Let's feel:
What occurs if it is not resolved?
Why is it crucial to fix it immediately?
Tell a tale of a person who was in their position. To emphasize the effects, use a true account of another person (or of yourself):
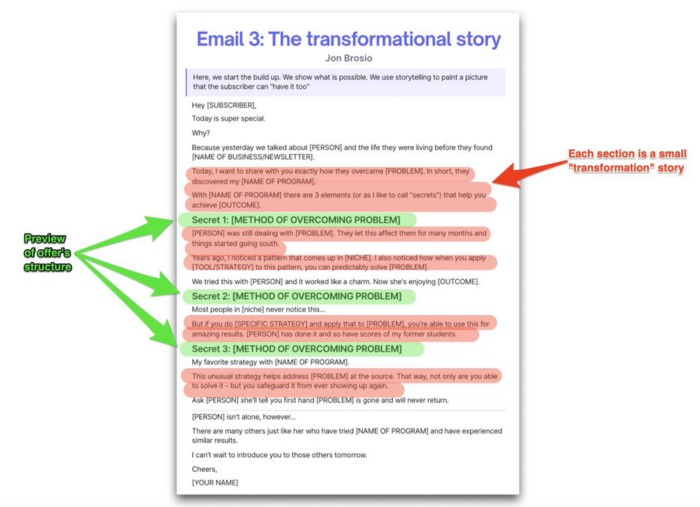
Email 3: Share a transformation story
Selling stories.
Whether in an email, landing page, article, or video. Humanize stories. They give information meaning.
This is where "issue" becomes "solution."
Let's reveal:
A tale of success
A new existence and result
tools and tactics employed
Start by transforming yourself.
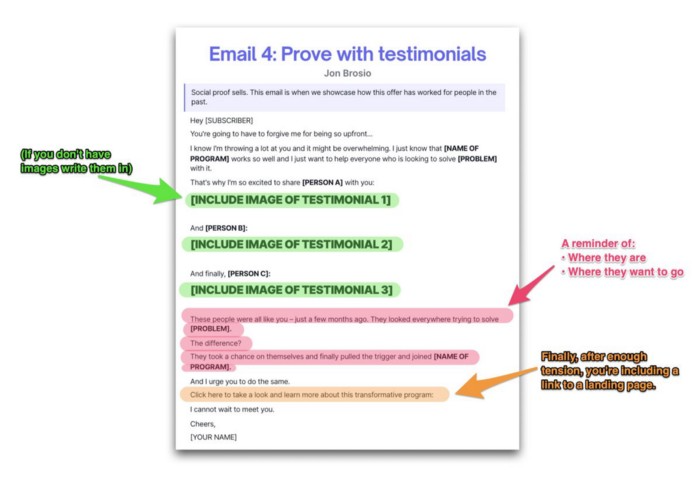
Email 4: Prove with testimonials
No one buys what you say.
Emotionally stirred people buy and act. They believe in the product. They feel that if they buy, it will work.
Social proof shows prospects that your solution will help them.
Add:
Earlier and Later
Testimonials
Reviews
Proof this deal works:
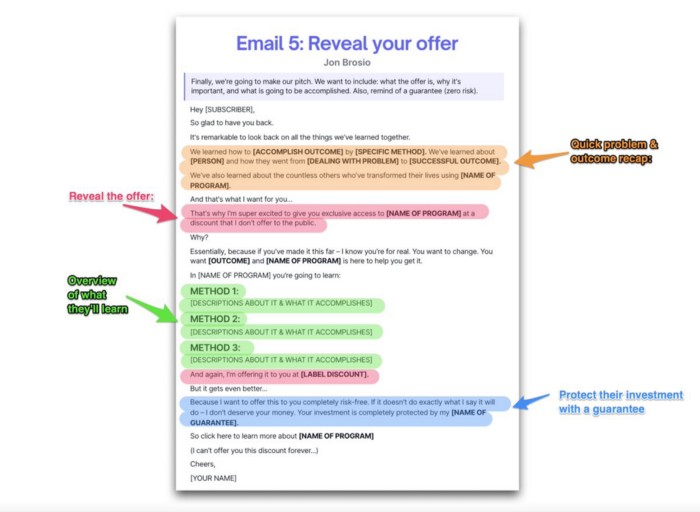
Email 5: Reveal your offer
It's showtime.
This is it. Until now, describing the offer and offering links to a landing page have been sparse in the email pictures.
We've been tense. Gaining steam. Building suspense. Email 5 reveals all.
In this email:
a description of the deal
A word about a promise
recapitulation of the transformation
and make a reference to the urgency Everything should be spelled out clearly:
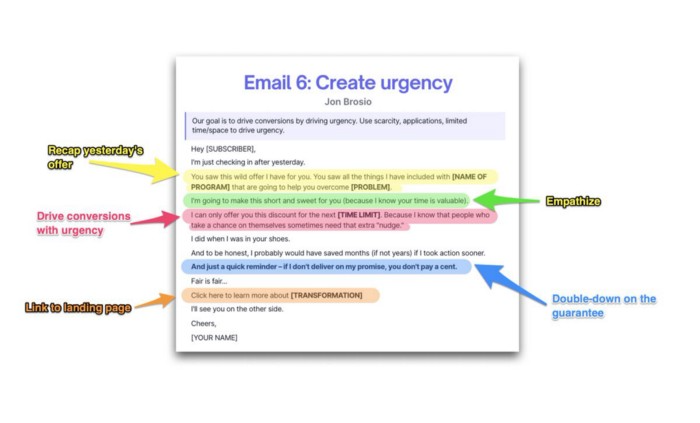
Email no. 6: Instill urgency
When there are stakes, humans act.
Creating and marketing with haste raises the stakes. Urgency makes a prospect act because they'll miss out or gain immensely.
Urgency converts. Use:
short time
Screening
Scarcity
Urgency and conversions. Limited-time offers are easy.
TL;DR
Use this proven 6-part email sequence (that turns subscribers into profit):
Introduce a problem
Amplify it with emotions
Share transformation story
Prove it works with testimonials
Value-stack and present your offer
Drive urgency and entice the purchase
You might also like

Sammy Abdullah
3 years ago
How to properly price SaaS
Price Intelligently put out amazing content on pricing your SaaS product. This blog's link to the whole report is worth reading. Our key takeaways are below.

Don't base prices on the competition. Competitor-based pricing has clear drawbacks. Their pricing approach is yours. Your company offers customers something unique. Otherwise, you wouldn't create it. This strategy is static, therefore you can't add value by raising prices without outpricing competitors. Look, but don't touch is the competitor-based moral. You want to know your competitors' prices so you're in the same ballpark, but they shouldn't guide your selections. Competitor-based pricing also drives down prices.
Value-based pricing wins. This is customer-based pricing. Value-based pricing looks outward, not inward or laterally at competitors. Your clients are the best source of pricing information. By valuing customer comments, you're focusing on buyers. They'll decide if your pricing and packaging are right. In addition to asking consumers about cost savings or revenue increases, look at data like number of users, usage per user, etc.
Value-based pricing increases prices. As you learn more about the client and your worth, you'll know when and how much to boost rates. Every 6 months, examine pricing.
Cloning top customers. You clone your consumers by learning as much as you can about them and then reaching out to comparable people or organizations. You can't accomplish this without knowing your customers. Segmenting and reproducing them requires as much detail as feasible. Offer pricing plans and feature packages for 4 personas. The top plan should state Contact Us. Your highest-value customers want more advice and support.
Question your 4 personas. What's the one item you can't live without? Which integrations matter most? Do you do analytics? Is support important or does your company self-solve? What's too cheap? What's too expensive?
Not everyone likes per-user pricing. SaaS organizations often default to per-user analytics. About 80% of companies utilizing per-user pricing should use an alternative value metric because their goods don't give more value with more users, so charging for them doesn't make sense.
At least 3:1 LTV/CAC. Break even on the customer within 2 years, and LTV to CAC is greater than 3:1. Because customer acquisition costs are paid upfront but SaaS revenues accrue over time, SaaS companies face an early financial shortfall while paying back the CAC.
ROI should be >20:1. Indeed. Ensure the customer's ROI is 20x the product's cost. Microsoft Office costs $80 a year, but consumers would pay much more to maintain it.
A/B Testing. A/B testing is guessing. When your pricing page varies based on assumptions, you'll upset customers. You don't have enough customers anyway. A/B testing optimizes landing pages, design decisions, and other site features when you know the problem but not pricing.
Don't discount. It cheapens the product, makes it permanent, and increases churn. By discounting, you're ruining your pricing analysis.

Merve Yılmaz
3 years ago
Dopamine detox
This post is for you if you can't read or study for 5 minutes.

If you clicked this post, you may be experiencing problems focusing on tasks. A few minutes of reading may tire you. Easily distracted? Using social media and video games for hours without being sidetracked may impair your dopamine system.
When we achieve a goal, the brain secretes dopamine. It might be as simple as drinking water or as crucial as college admission. Situations vary. Various events require different amounts.
Dopamine is released when we start learning but declines over time. Social media algorithms provide new material continually, making us happy. Social media use slows down the system. We can't continue without an award. We return to social media and dopamine rewards.
Mice were given a button that released dopamine into their brains to study the hormone. The mice lost their hunger, thirst, and libido and kept pressing the button. Think this is like someone who spends all day gaming or on Instagram?
When we cause our brain to release so much dopamine, the brain tries to balance it in 2 ways:
1- Decreases dopamine production
2- Dopamine cannot reach its target.
Too many quick joys aren't enough. We'll want more joys. Drugs and alcohol are similar. Initially, a beer will get you drunk. After a while, 3-4 beers will get you drunk.
Social media is continually changing. Updates to these platforms keep us interested. When social media conditions us, we can't read a book.
Same here. I used to complete a book in a day and work longer without distraction. Now I'm addicted to Instagram. Daily, I spend 2 hours on social media. This must change. My life needs improvement. So I started the 50-day challenge.
I've compiled three dopamine-related methods.
Recommendations:
Day-long dopamine detox
First, take a day off from all your favorite things. Social media, gaming, music, junk food, fast food, smoking, alcohol, friends. Take a break.
Hanging out with friends or listening to music may seem pointless. Our minds are polluted. One day away from our pleasures can refresh us.
2. One-week dopamine detox by selecting
Choose one or more things to avoid. Social media, gaming, music, junk food, fast food, smoking, alcohol, friends. Try a week without Instagram or Twitter. I use this occasionally.
One week all together
One solid detox week. It's the hardest program. First or second options are best for dopamine detox. Time will help you.
You can walk, read, or pray during a dopamine detox. Many options exist. If you want to succeed, you must avoid instant gratification. Success after hard work is priceless.
Liam Vaughan
4 years ago
Investors can bet big on almost anything on a new prediction market.
Kalshi allows five-figure bets on the Grammys, the next Covid wave, and future SEC commissioners. Worst-case scenario
On Election Day 2020, two young entrepreneurs received a call from the CFTC chairman. Luana Lopes Lara and Tarek Mansour spent 18 months trying to start a new type of financial exchange. Instead of betting on stock prices or commodity futures, people could trade instruments tied to real-world events, such as legislation, the weather, or the Oscar winner.
Heath Tarbert, a Trump appointee, shouted "Congratulations." "You're competing with 1840s-era markets. I'm sure you'll become a powerhouse too."
Companies had tried to introduce similar event markets in the US for years, but Tarbert's agency, the CFTC, said no, arguing they were gambling and prone to cheating. Now the agency has reversed course, approving two 24-year-olds who will have first-mover advantage in what could become a huge new asset class. Kalshi Inc. raised $30 million from venture capitalists within weeks of Tarbert's call, his representative says. Mansour, 26, believes this will be bigger than crypto.
Anyone who's read The Wisdom of Crowds knows prediction markets' potential. Well-designed markets can help draw out knowledge from disparate groups, and research shows that when money is at stake, people make better predictions. Lopes Lara calls it a "bullshit tax." That's why Google, Microsoft, and even the US Department of Defense use prediction markets internally to guide decisions, and why university-linked political betting sites like PredictIt sometimes outperform polls.
Regulators feared Wall Street-scale trading would encourage investors to manipulate reality. If the stakes are high enough, traders could pressure congressional staffers to stall a bill or bet on whether Kanye West's new album will drop this week. When Lopes Lara and Mansour pitched the CFTC, senior regulators raised these issues. Politically appointed commissioners overruled their concerns, and one later joined Kalshi's board.
Will Kanye’s new album come out next week? Yes or no?
Kalshi's victory was due more to lobbying and legal wrangling than to Silicon Valley-style innovation. Lopes Lara and Mansour didn't invent anything; they changed a well-established concept's governance. The result could usher in a new era of market-based enlightenment or push Wall Street's destructive tendencies into the real world.
If Kalshi's founders lacked experience to bolster their CFTC application, they had comical youth success. Lopes Lara studied ballet at the Brazilian Bolshoi before coming to the US. Mansour won France's math Olympiad. They bonded over their work ethic in an MIT computer science class.
Lopes Lara had the idea for Kalshi while interning at a New York hedge fund. When the traders around her weren't working, she noticed they were betting on the news: Would Apple hit a trillion dollars? Kylie Jenner? "It was anything," she says.
Are mortgage rates going up? Yes or no?
Mansour saw the business potential when Lopes Lara suggested it. He interned at Goldman Sachs Group Inc., helping investors prepare for the UK leaving the EU. Goldman sold clients complex stock-and-derivative combinations. As he discussed it with Lopes Lara, they agreed that investors should hedge their risk by betting on Brexit itself rather than an imperfect proxy.
Lopes Lara and Mansour hypothesized how a marketplace might work. They settled on a "event contract," a binary-outcome instrument like "Will inflation hit 5% by the end of the month?" The contract would settle at $1 (if the event happened) or zero (if it didn't), but its price would fluctuate based on market sentiment. After a good debate, a politician's election odds may rise from 50 to 55. Kalshi would charge a commission on every trade and sell data to traders, political campaigns, businesses, and others.
In October 2018, five months after graduation, the pair flew to California to compete in a hackathon for wannabe tech founders organized by the Silicon Valley incubator Y Combinator. They built a website in a day and a night and presented it to entrepreneurs the next day. Their prototype barely worked, but they won a three-month mentorship program and $150,000. Michael Seibel, managing director of Y Combinator, said of their idea, "I had to take a chance!"
Will there be another moon landing by 2025?
Seibel's skepticism was rooted in America's historical wariness of gambling. Roulette, poker, and other online casino games are largely illegal, and sports betting was only legal in a few states until May 2018. Kalshi as a risk-hedging platform rather than a bookmaker seemed like a good idea, but convincing the CFTC wouldn't be easy. In 2012, the CFTC said trading on politics had no "economic purpose" and was "contrary to the public interest."
Lopes Lara and Mansour cold-called 60 Googled lawyers during their time at Y Combinator. Everyone advised quitting. Mansour recalls the pain. Jeff Bandman, a former CFTC official, helped them navigate the agency and its characters.
When they weren’t busy trying to recruit lawyers, Lopes Lara and Mansour were meeting early-stage investors. Alfred Lin of Sequoia Capital Operations LLC backed Airbnb, DoorDash, and Uber Technologies. Lin told the founders their idea could capitalize on retail trading and challenge how the financial world manages risk. "Come back with regulatory approval," he said.
In the US, even small bets on most events were once illegal. Under the Commodity Exchange Act, the CFTC can stop exchanges from listing contracts relating to "terrorism, assassination, war" and "gaming" if they are "contrary to the public interest," which was often the case.
Will subway ridership return to normal? Yes or no?
In 1988, as academic interest in the field grew, the agency allowed the University of Iowa to set up a prediction market for research purposes, as long as it didn't make a profit or advertise and limited bets to $500. PredictIt, the biggest and best-known political betting platform in the US, also got an exemption thanks to an association with Victoria University of Wellington in New Zealand. Today, it's a sprawling marketplace with its own subculture and lingo. PredictIt users call it "Rules Cuck Panther" when they lose on a technicality. Major news outlets cite PredictIt's odds on Discord and the Star Spangled Gamblers podcast.
CFTC limits PredictIt bets to $850. To keep traders happy, PredictIt will often run multiple variations of the same question, listing separate contracts for two dozen Democratic primary candidates, for example. A trader could have more than $10,000 riding on a single outcome. Some of the site's traders are current or former campaign staffers who can answer questions like "How many tweets will Donald Trump post from Nov. 20 to 27?" and "When will Anthony Scaramucci's role as White House communications director end?"
According to PredictIt co-founder John Phillips, politicians help explain the site's accuracy. "Prediction markets work well and are accurate because they attract people with superior information," he said in a 2016 podcast. “In the financial stock market, it’s called inside information.”
Will Build Back Better pass? Yes or no?
Trading on nonpublic information is illegal outside of academia, which presented a dilemma for Lopes Lara and Mansour. Kalshi's forecasts needed to be accurate. Kalshi must eliminate insider trading as a regulated entity. Lopes Lara and Mansour wanted to build a high-stakes PredictIt without the anarchy or blurred legal lines—a "New York Stock Exchange for Events." First, they had to convince regulators event trading was safe.
When Lopes Lara and Mansour approached the CFTC in the spring of 2019, some officials in the Division of Market Oversight were skeptical, according to interviews with people involved in the process. For all Kalshi's talk of revolutionizing finance, this was just a turbocharged version of something that had been rejected before.
The DMO couldn't see the big picture. The staff review was supposed to ensure Kalshi could complete a checklist, "23 Core Principles of a Designated Contract Market," which included keeping good records and having enough money. The five commissioners decide. With Trump as president, three of them were ideologically pro-market.
Lopes Lara, Mansour, and their lawyer Bandman, an ex-CFTC official, answered the DMO's questions while lobbying the commissioners on Zoom about the potential of event markets to mitigate risks and make better decisions. Before each meeting, they would write a script and memorize it word for word.
Will student debt be forgiven? Yes or no?
Several prediction markets that hadn't sought regulatory approval bolstered Kalshi's case. Polymarket let customers bet hundreds of thousands of dollars anonymously using cryptocurrencies, making it hard to track. Augur, which facilitates private wagers between parties using blockchain, couldn't regulate bets and hadn't stopped users from betting on assassinations. Kalshi, by comparison, argued it was doing everything right. (The CFTC fined Polymarket $1.4 million for operating an unlicensed exchange in January 2022. Polymarket says it's now compliant and excited to pioneer smart contract-based financial solutions with regulators.
Kalshi was approved unanimously despite some DMO members' concerns about event contracts' riskiness. "Once they check all the boxes, they're in," says a CFTC insider.
Three months after CFTC approval, Kalshi announced funding from Sequoia, Charles Schwab, and Henry Kravis. Sequoia's Lin, who joined the board, said Tarek, Luana, and team created a new way to invest and engage with the world.
The CFTC hadn't asked what markets the exchange planned to run since. After approval, Lopes Lara and Mansour had the momentum. Kalshi's March list of 30 proposed contracts caused chaos at the DMO. The division handles exchanges that create two or three new markets a year. Kalshi’s business model called for new ones practically every day.
Uncontroversial proposals included weather and GDP questions. Others, on the initial list and later, were concerning. DMO officials feared Covid-19 contracts amounted to gambling on human suffering, which is why war and terrorism markets are banned. (Similar logic doomed ex-admiral John Poindexter's Policy Analysis Market, a Bush-era plan to uncover intelligence by having security analysts bet on Middle East events.) Regulators didn't see how predicting the Grammy winners was different from betting on the Patriots to win the Super Bowl. Who, other than John Legend, would need to hedge the best R&B album winner?
Event contracts raised new questions for the DMO's product review team. Regulators could block gaming contracts that weren't in the public interest under the Commodity Exchange Act, but no one had defined gaming. It was unclear whether the CFTC had a right or an obligation to consider whether a contract was in the public interest. How was it to determine public interest? Another person familiar with the CFTC review says, "It was a mess." The agency didn't comment.
CFTC staff feared some event contracts could be cheated. Kalshi wanted to run a bee-endangerment market. The DMO pushed back, saying it saw two problems symptomatic of the asset class: traders could press government officials for information, and officials could delay adding the insects to the list to cash in.
The idea that traders might manipulate prediction markets wasn't paranoid. In 2013, academics David Rothschild and Rajiv Sethi found that an unidentified party lost $7 million buying Mitt Romney contracts on Intrade, a now-defunct, unlicensed Irish platform, in the runup to the 2012 election. The authors speculated that the trader, whom they dubbed the “Romney Whale,” may have been looking to boost morale and keep donations coming in.
Kalshi said manipulation and insider trading are risks for any market. It built a surveillance system and said it would hire a team to monitor it. "People trade on events all the time—they just use options and other instruments. This brings everything into the open, Mansour says. Kalshi didn't include election contracts, a red line for CFTC Democrats.
Lopes Lara and Mansour were ready to launch kalshi.com that summer, but the DMO blocked them. Product reviewers were frustrated by spending half their time on an exchange that represented a tiny portion of the derivatives market. Lopes Lara and Mansour pressed politically appointed commissioners during the impasse.
Tarbert, the chairman, had moved on, but Kalshi found a new supporter in Republican Brian Quintenz, a crypto-loving former hedge fund manager. He was unmoved by the DMO's concerns, arguing that speculation on Kalshi's proposed events was desirable and the agency had no legal standing to prevent it. He supported a failed bid to allow NFL futures earlier this year. Others on the commission were cautious but supportive. Given the law's ambiguity, they worried they'd be on shaky ground if Kalshi sued if they blocked a contract. Without a permanent chairman, the agency lacked leadership.
To block a contract, DMO staff needed a majority of commissioners' support, which they didn't have in all but a few cases. "We didn't have the votes," a reviewer says, paraphrasing Hamilton. By the second half of 2021, new contract requests were arriving almost daily at the DMO, and the demoralized and overrun division eventually accepted defeat and stopped fighting back. By the end of the year, three senior DMO officials had left the agency, making it easier for Kalshi to list its contracts unimpeded.
Today, Kalshi is growing. 32 employees work in a SoHo office with big windows and exposed brick. Quintenz, who left the CFTC 10 months after Kalshi was approved, is on its board. He joined because he was interested in the market's hedging and risk management opportunities.
Mid-May, the company's website had 75 markets, such as "Will Q4 GDP be negative?" Will NASA land on the moon by 2025? The exchange recently reached 2 million weekly contracts, a jump from where it started but still a small number compared to other futures exchanges. Early adopters are PredictIt and Polymarket fans. Bets on the site are currently capped at $25,000, but Kalshi hopes to increase that to $100,000 and beyond.
With the regulatory drawbridge down, Lopes Lara and Mansour must move quickly. Chicago's CME Group Inc. plans to offer index-linked event contracts. Kalshi will release a smartphone app to attract customers. After that, it hopes to partner with a big brokerage. Sequoia is a major investor in Robinhood Markets Inc. Robinhood users could have access to Kalshi so that after buying GameStop Corp. shares, they'd be prompted to bet on the Oscars or the next Fed commissioner.
Some, like Illinois Democrat Sean Casten, accuse Robinhood and its competitors of gamifying trading to encourage addiction, but Kalshi doesn't seem worried. Mansour says Kalshi's customers can't bet more than they've deposited, making debt difficult. Eventually, he may introduce leveraged bets.
Tension over event contracts recalls another CFTC episode. Brooksley Born proposed regulating the financial derivatives market in 1994. Alan Greenspan and others in the government opposed her, saying it would stifle innovation and push capital overseas. Unrestrained, derivatives grew into a trillion-dollar industry until 2008, when they sparked the financial crisis.
Today, with a midterm election looming, it seems reasonable to ask whether Kalshi plans to get involved. Elections have historically been the biggest draw in prediction markets, with 125 million shares traded on PredictIt for 2020. “We can’t discuss specifics,” Mansour says. “All I can say is, you know, we’re always working on expanding the universe of things that people can trade on.”
Any election contracts would need CFTC approval, which may be difficult with three Democratic commissioners. A Republican president would change the equation.