


More on Productivity

Alex Mathers
3 years ago
8 guidelines to help you achieve your objectives 5x fast
If you waste time every day, even though you're ambitious, you're not alone.
Many of us could use some new time-management strategies, like these:
Focus on the following three.
You're thinking about everything at once.
You're overpowered.
It's mental. We just have what's in front of us. So savor the moment's beauty.
Prioritize 1-3 things.
To be one of the most productive people you and I know, follow these steps.
Get along with boredom.
Many of us grow bored, sweat, and turn on Netflix.
We shout, "I'm rarely bored!" Look at me! I'm happy.
Shut it, Sally.
You're not making wonderful things for the world. Boredom matters.
If you can sit with it for a second, you'll get insight. Boredom? Breathe.
Go blank.
Then watch your creativity grow.
Check your MacroVision once more.
We don't know what to do with our time, which contributes to time-wasting.
Nobody does, either. Jeff Bezos won't hand-deliver that crap to you.
Daily vision checks are required.
Also:
What are 5 things you'd love to create in the next 5 years?
You're soul-searching. It's food.
Return here regularly, and you'll adore the high you get from doing valuable work.
Improve your thinking.
What's Alex's latest nonsense?
I'm talking about overcoming our own thoughts. Worrying wastes so much time.
Too many of us are assaulted by lies, myths, and insecurity.
Stop letting your worries massage you into a worried coma like a Thai woman.
Optimizing your thoughts requires accepting what you can't control.
It means letting go of unhelpful thoughts and returning to the moment.
Keep your blood sugar level.
I gave up gluten, donuts, and sweets.
This has really boosted my energy.
Blood-sugar-spiking carbs make us irritable and tired.
These day-to-day ups and downs aren't productive. It's crucial.
Know how your diet affects insulin levels. Now I have more energy and can do more without clenching my teeth.
Reduce harmful carbs to boost energy.
Create a focused setting for yourself.
When we optimize the mind, we have more energy and use our time better because we're not tense.
Changing our environment can also help us focus. Disabling alerts is one example.
Too hot makes me procrastinate and irritable.
List five items that hinder your productivity.
You may be amazed at how much you may improve by removing distractions.
Be responsible.
Accountability is a time-saver.
Creating an emotional pull to finish things.
Writing down our goals makes us accountable.
We can engage a coach or work with an accountability partner to feel horrible if we don't show up and finish on time.
‘Hey Jake, I’m going to write 1000 words every day for 30 days — you need to make sure I do.’ ‘Sure thing, Nathan, I’ll be making sure you check in daily with me.’
Tick.
You might also blog about your ambitions to show your dedication.
Now you can't hide when you promised to appear.
Acquire a liking for bravery.
Boldness changes everything.
I sometimes feel lazy and wonder why. If my food and sleep are in order, I should assess my footing.
Most of us live backward. Doubtful. Uncertain. Feelings govern us.
Backfooting isn't living. It's lame, and you'll soon melt. Live boldly now.
Be assertive.
Get disgustingly into everything. Expand.
Even if it's hard, stop being a b*tch.
Those that make Mr. Bold Bear their spirit animal benefit. Save time to maximize your effect.

Taher Batterywala
3 years ago
Do You Have Focus Issues? Use These 5 Simple Habits
Many can't concentrate. The first 20% of the day isn't optimized.
Elon Musk, Tony Robbins, and Bill Gates share something:
Morning Routines.
A repeatable morning ritual saves time.
The result?
Time for hobbies.
I'll discuss 5 easy morning routines you can use.
1. Stop pressing snooze
Waking up starts the day. You disrupt your routine by hitting snooze.
One sleep becomes three. Your morning routine gets derailed.
Fix it:
Hide your phone. This disables snooze and wakes you up.
Once awake, staying awake is 10x easier. Simple trick, big results.
2. Drink water
Chronic dehydration is common. Mostly urban, air-conditioned workers/residents.
2% cerebral dehydration causes short-term memory loss.
Dehydration shrinks brain cells.
Drink 3-4 liters of water daily to avoid this.
3. Improve your focus
How to focus better?
Meditation.
Improve your mood
Enhance your memory
increase mental clarity
Reduce blood pressure and stress
Headspace helps with the habit.
Here's a meditation guide.
Sit comfortably
Shut your eyes.
Concentrate on your breathing
Breathe in through your nose
Breathe out your mouth.
5 in, 5 out.
Repeat for 1 to 20 minutes.
Here's a beginner's video:
4. Workout
Exercise raises:
Mental Health
Effort levels
focus and memory
15-60 minutes of fun:
Exercise Lifting
Running
Walking
Stretching and yoga
This helps you now and later.
5. Keep a journal
You have countless thoughts daily. Many quietly steal your focus.
Here’s how to clear these:
Write for 5-10 minutes.
You'll gain 2x more mental clarity.
Recap
5 morning practices for 5x more productivity:
Say no to snoozing
Hydrate
Improve your focus
Exercise
Journaling
Conclusion
One step starts a thousand-mile journey. Try these easy yet effective behaviors if you have trouble concentrating or have too many thoughts.
Start with one of these behaviors, then add the others. Its astonishing results are instant.

The woman
3 years ago
I received a $2k bribe to replace another developer in an interview
I can't believe they’d even think it works!

Developers are usually interviewed before being hired, right? Every organization wants candidates who meet their needs. But they also want to avoid fraud.
There are cheaters in every field. Only two come to mind for the hiring process:
Lying on a resume.
Cheating on an online test.
Recently, I observed another one. One of my coworkers invited me to replace another developer during an online interview! I was astonished, but it’s not new.
The specifics
My ex-colleague recently texted me. No one from your former office will ever approach you after a year unless they need something.
Which was the case. My coworker said his wife needed help as a programmer. I was glad someone asked for my help, but I'm still a junior programmer.
Then he informed me his wife was selected for a fantastic job interview. He said he could help her with the online test, but he needed someone to help with the online interview.
Okay, I guess. Preparing for an online interview is beneficial. But then he said she didn't need to be ready. She needed someone to take her place.
I told him it wouldn't work. Every remote online interview I've ever seen required an open camera.
What followed surprised me. She'd ask to turn off the camera, he said.
I asked why.
He told me if an applicant is unwell, the interviewer may consider an off-camera interview. His wife will say she's sick and prefers no camera.
The plan left me speechless. I declined politely. He insisted and promised $2k if she got the job.
I felt insulted and told him if he persisted, I'd inform his office. I was furious. Later, I apologized and told him to stop.
I'm not sure what they did after that
I'm not sure if they found someone or listened to me. They probably didn't. How would she do the job if she even got it?
It's an internship, he said. With great pay, though. What should an intern do?
I suggested she do the interview alone. Even if she failed, she'd gain confidence and valuable experience.
Conclusion
Many interviewees cheat. My profession is vital to me, thus I'd rather improve my abilities and apply honestly. It's part of my identity.
Am I truthful? Most professionals are not. They fabricate their CVs. Often.
When you support interview cheating, you encourage more cheating! When someone cheats, another qualified candidate may not obtain the job.
One day, that could be you or me.
You might also like

Jari Roomer
3 years ago
Successful people have this one skill.
Without self-control, you'll waste time chasing dopamine fixes.
I found a powerful quote in Tony Robbins' Awaken The Giant Within:
“Most of the challenges that we have in our personal lives come from a short-term focus” — Tony Robbins
Most people are short-term oriented, but highly successful people are long-term oriented.
Successful people act in line with their long-term goals and values, while the rest are distracted by short-term pleasures and dopamine fixes.
Instant gratification wrecks lives
Instant pleasure is fleeting. Quickly fading effects leave you craving more stimulation.
Before you know it, you're in a cycle of quick fixes. This explains binging on food, social media, and Netflix.
These things cause a dopamine spike, which is entertaining. This dopamine spike crashes quickly, leaving you craving more stimulation.
It's fine to watch TV or play video games occasionally. Problems arise when brain impulses aren't controlled. You waste hours chasing dopamine fixes.
Instant gratification becomes problematic when it interferes with long-term goals, happiness, and life fulfillment.
Most rewarding things require delay
Life's greatest rewards require patience and delayed gratification. They must be earned through patience, consistency, and effort.
Ex:
A fit, healthy body
A deep connection with your spouse
A thriving career/business
A healthy financial situation
These are some of life's most rewarding things, but they take work and patience. They all require the ability to delay gratification.
To have a healthy bank account, you must save (and invest) a large portion of your monthly income. This means no new tech or clothes.
If you want a fit, healthy body, you must eat better and exercise three times a week. So no fast food and Netflix.
It's a battle between what you want now and what you want most.
Successful people choose what they want most over what they want now. It's a major difference.
Instant vs. delayed gratification
Most people subconsciously prefer instant rewards over future rewards, even if the future rewards are more significant.
We humans aren't logical. Emotions and instincts drive us. So we act against our goals and values.
Fortunately, instant gratification bias can be overridden. This is a modern superpower. Effective methods include:
#1: Train your brain to handle overstimulation
Training your brain to function without constant stimulation is a powerful change. Boredom can lead to long-term rewards.
Unlike impulsive shopping, saving money is boring. Having lots of cash is amazing.
Compared to video games, deep work is boring. A successful online business is rewarding.
Reading books is boring compared to scrolling through funny videos on social media. Knowledge is invaluable.
You can't do these things if your brain is overstimulated. Your impulses will control you. To reduce overstimulation addiction, try:
Daily meditation (10 minutes is enough)
Daily study/work for 90 minutes (no distractions allowed)
First hour of the day without phone, social media, and Netflix
Nature walks, journaling, reading, sports, etc.
#2: Make Important Activities Less Intimidating
Instant gratification helps us cope with stress. Starting a book or business can be intimidating. Video games and social media offer a quick escape in such situations.
Make intimidating tasks less so. Break them down into small tasks. Start a new business/side-hustle by:
Get domain name
Design website
Write out a business plan
Research competition/peers
Approach first potential client
Instead of one big mountain, divide it into smaller sub-tasks. This makes a task easier and less intimidating.
#3: Plan ahead for important activities
Distractions will invade unplanned time. Your time is dictated by your impulses, which are usually Netflix, social media, fast food, and video games. It wants quick rewards and dopamine fixes.
Plan your days and be proactive with your time. Studies show that scheduling activities makes you 3x more likely to do them.
To achieve big goals, you must plan. Don't gamble.
Want to get fit? Schedule next week's workouts. Want a side-job? Schedule your work time.

Zuzanna Sieja
3 years ago
In 2022, each data scientist needs to read these 11 books.

Non-technical talents can benefit data scientists in addition to statistics and programming.
As our article 5 Most In-Demand Skills for Data Scientists shows, being business-minded is useful. How can you get such a diverse skill set? We've compiled a list of helpful resources.
Data science, data analysis, programming, and business are covered. Even a few of these books will make you a better data scientist.
Ready? Let’s dive in.
Best books for data scientists
1. The Black Swan
Author: Nassim Taleb
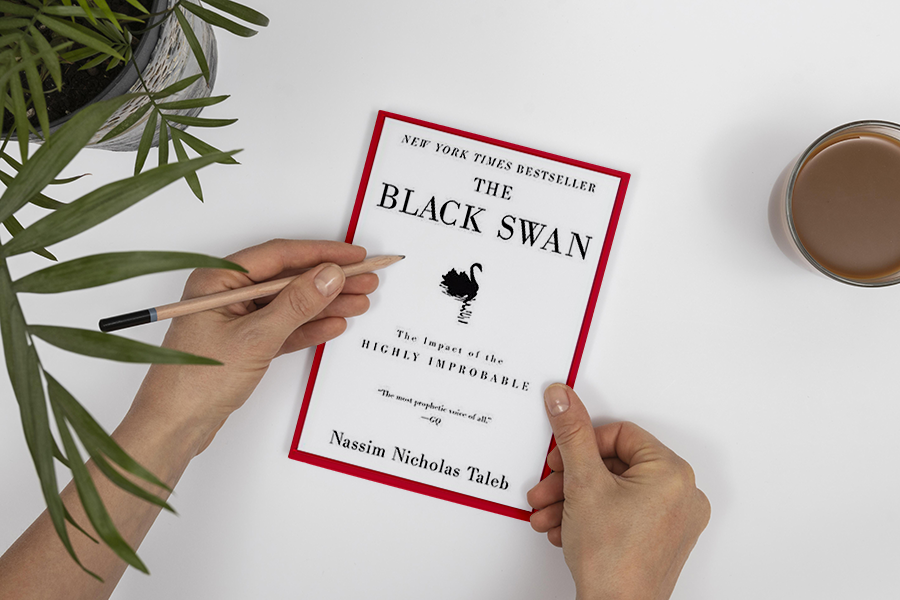
First, a less obvious title. Nassim Nicholas Taleb's seminal series examines uncertainty, probability, risk, and decision-making.
Three characteristics define a black swan event:
It is erratic.
It has a significant impact.
Many times, people try to come up with an explanation that makes it seem more predictable than it actually was.
People formerly believed all swans were white because they'd never seen otherwise. A black swan in Australia shattered their belief.
Taleb uses this incident to illustrate how human thinking mistakes affect decision-making. The book teaches readers to be aware of unpredictability in the ever-changing IT business.
Try multiple tactics and models because you may find the answer.
2. High Output Management
Author: Andrew Grove
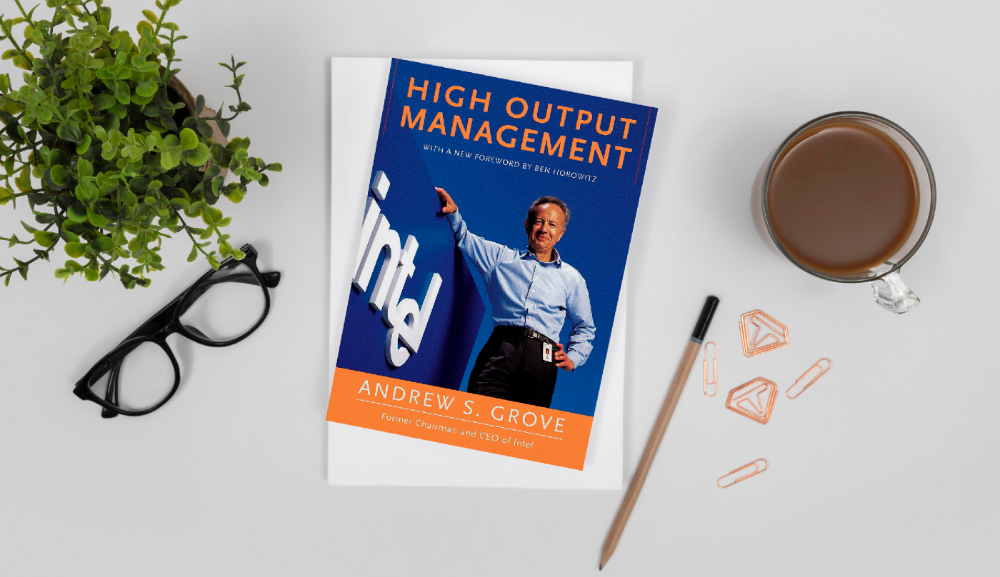
Intel's former chairman and CEO provides his insights on developing a global firm in this business book. We think Grove would choose “management” to describe the talent needed to start and run a business.
That's a skill for CEOs, techies, and data scientists. Grove writes on developing productive teams, motivation, real-life business scenarios, and revolutionizing work.
Five lessons:
Every action is a procedure.
Meetings are a medium of work
Manage short-term goals in accordance with long-term strategies.
Mission-oriented teams accelerate while functional teams increase leverage.
Utilize performance evaluations to enhance output.
So — if the above captures your imagination, it’s well worth getting stuck in.
3. The Hard Thing About Hard Things: Building a Business When There Are No Easy Answers
Author: Ben Horowitz
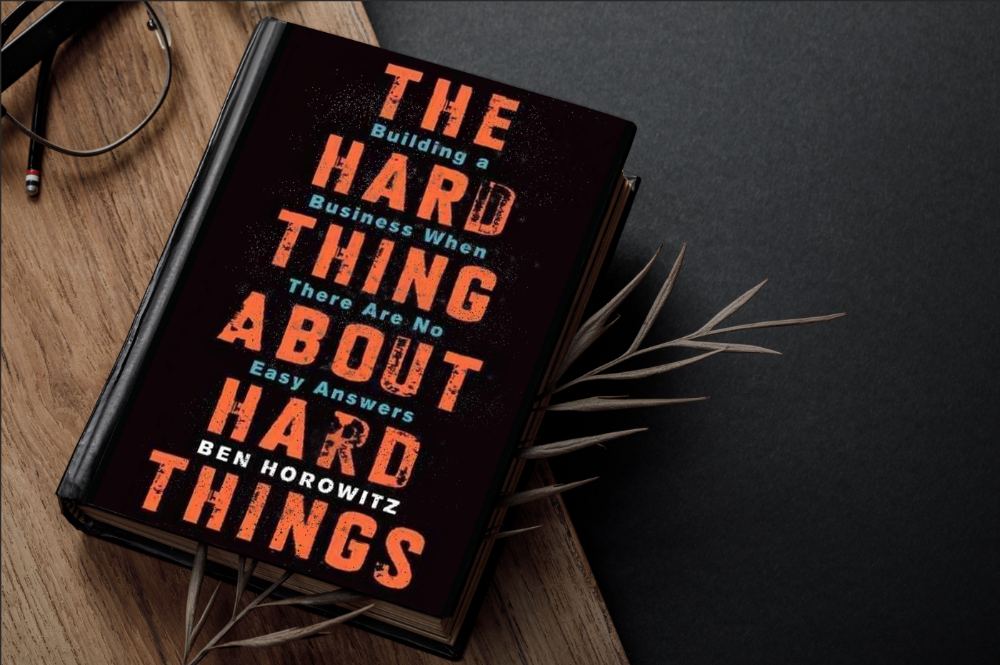
Few realize how difficult it is to run a business, even though many see it as a tremendous opportunity.
Business schools don't teach managers how to handle the toughest difficulties; they're usually on their own. So Ben Horowitz wrote this book.
It gives tips on creating and maintaining a new firm and analyzes the hurdles CEOs face.
Find suggestions on:
create software
Run a business.
Promote a product
Obtain resources
Smart investment
oversee daily operations
This book will help you cope with tough times.
4. Obviously Awesome: How to Nail Product Positioning
Author: April Dunford
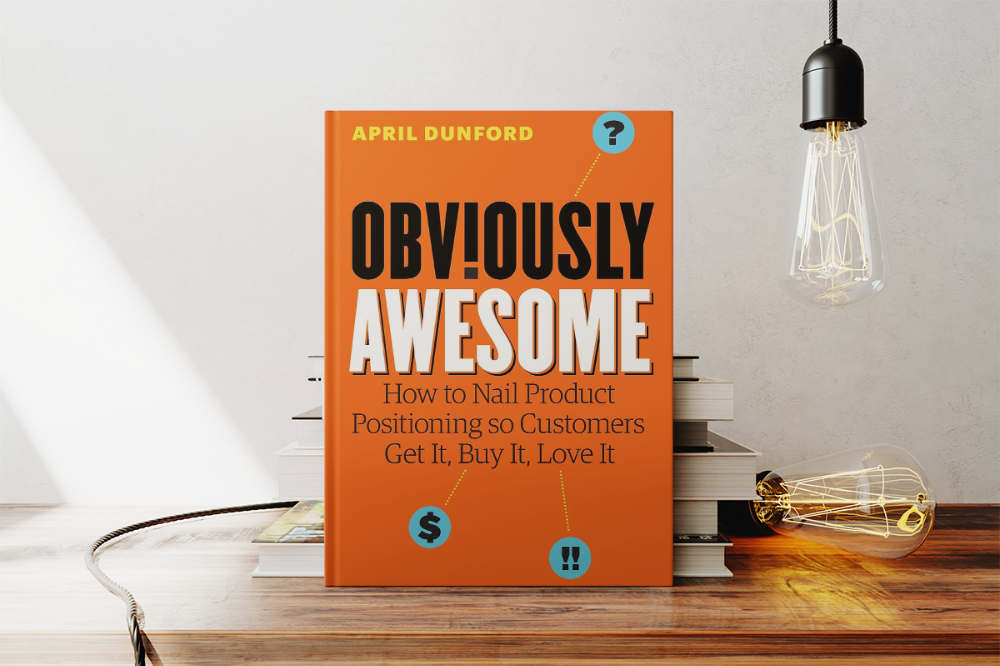
Your job as a data scientist is a product. You should be able to sell what you do to clients. Even if your product is great, you must convince them.
How to? April Dunford's advice: Her book explains how to connect with customers by making your offering seem like a secret sauce.
You'll learn:
Select the ideal market for your products.
Connect an audience to the value of your goods right away.
Take use of three positioning philosophies.
Utilize market trends to aid purchasers
5. The Mom test
Author: Rob Fitzpatrick

The Mom Test improves communication. Client conversations are rarely predictable. The book emphasizes one of the most important communication rules: enquire about specific prior behaviors.
Both ways work. If a client has suggestions or demands, listen carefully and ensure everyone understands. The book is packed with client-speaking tips.
6. Introduction to Machine Learning with Python: A Guide for Data Scientists
Authors: Andreas C. Müller, Sarah Guido
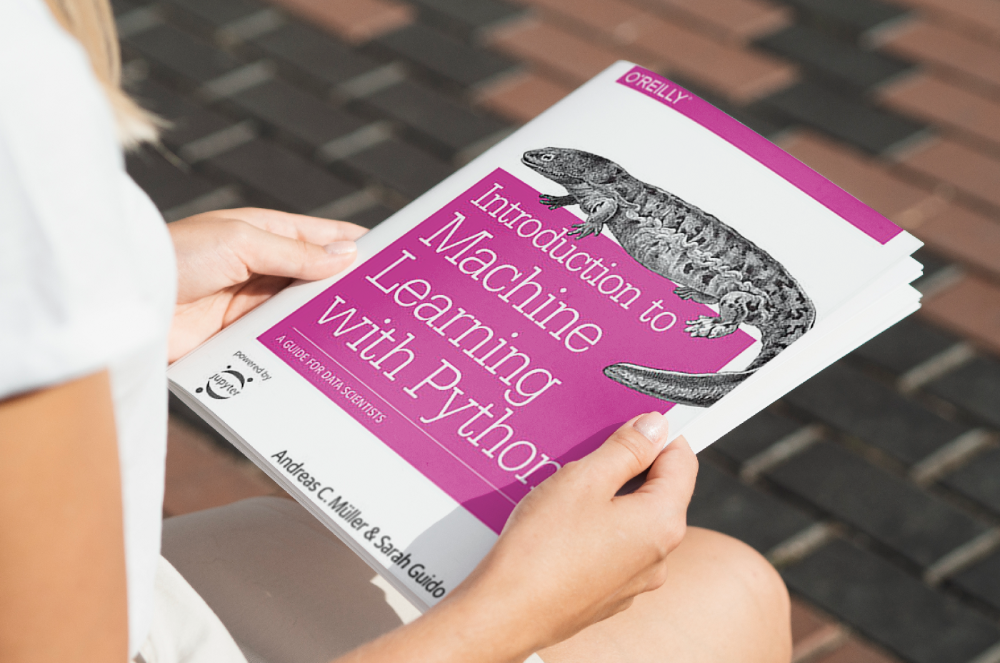
Now, technical documents.
This book is for Python-savvy data scientists who wish to learn machine learning. Authors explain how to use algorithms instead of math theory.
Their technique is ideal for developers who wish to study machine learning basics and use cases. Sci-kit-learn, NumPy, SciPy, pandas, and Jupyter Notebook are covered beyond Python.
If you know machine learning or artificial neural networks, skip this.
7. Python Data Science Handbook: Essential Tools for Working with Data
Author: Jake VanderPlas
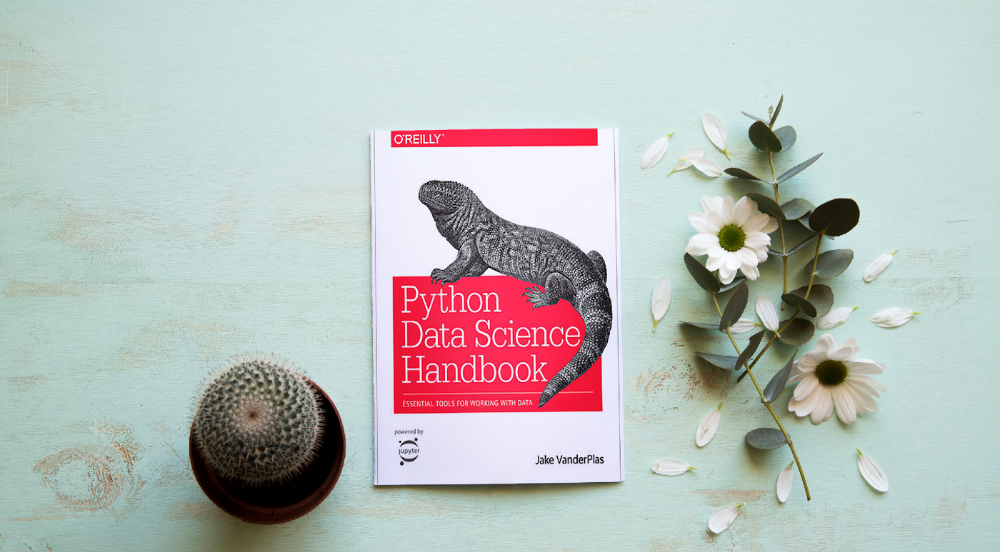
Data work isn't easy. Data manipulation, transformation, cleansing, and visualization must be exact.
Python is a popular tool. The Python Data Science Handbook explains everything. The book describes how to utilize Pandas, Numpy, Matplotlib, Scikit-Learn, and Jupyter for beginners.
The only thing missing is a way to apply your learnings.
8. Python for Data Analysis: Data Wrangling with Pandas, NumPy, and IPython
Author: Wes McKinney
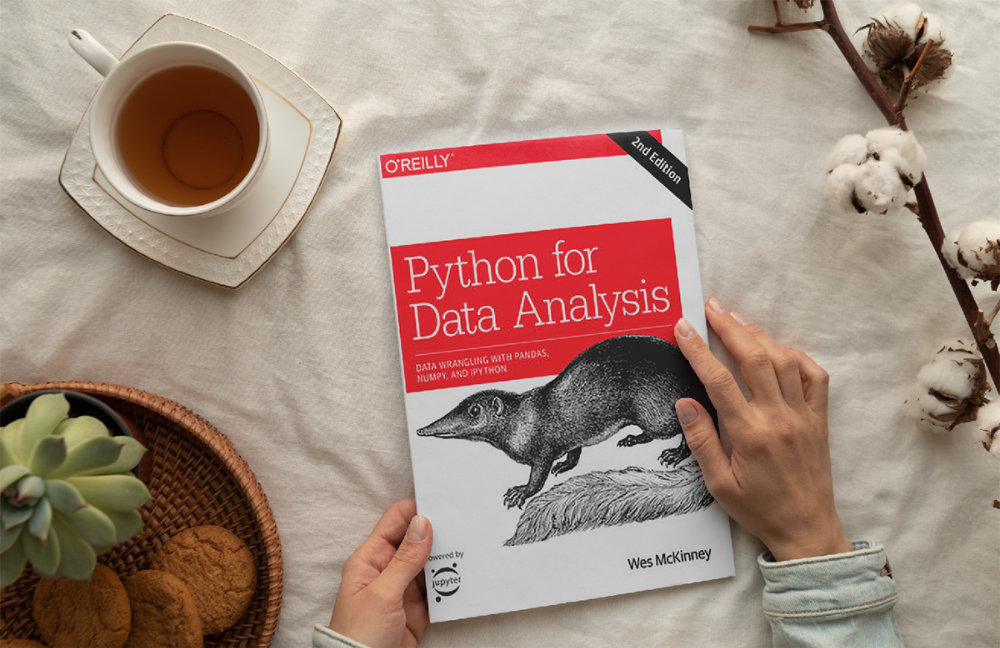
The author leads you through manipulating, processing, cleaning, and analyzing Python datasets using NumPy, Pandas, and IPython.
The book's realistic case studies make it a great resource for Python or scientific computing beginners. Once accomplished, you'll uncover online analytics, finance, social science, and economics solutions.
9. Data Science from Scratch
Author: Joel Grus
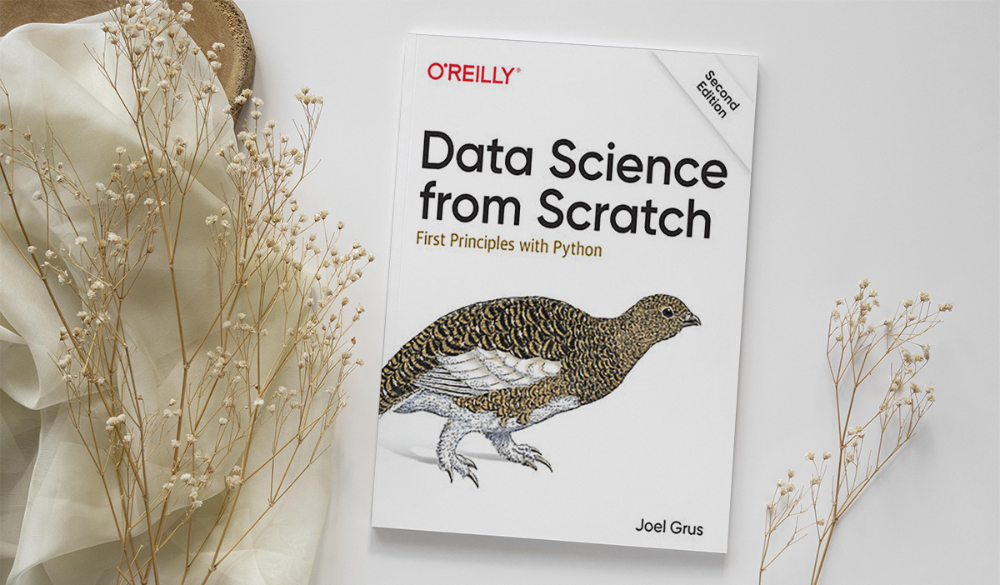
Here's a title for data scientists with Python, stats, maths, and algebra skills (alongside a grasp of algorithms and machine learning). You'll learn data science's essential libraries, frameworks, modules, and toolkits.
The author works through all the key principles, providing you with the practical abilities to develop simple code. The book is appropriate for intermediate programmers interested in data science and machine learning.
Not that prior knowledge is required. The writing style matches all experience levels, but understanding will help you absorb more.
10. Machine Learning Yearning
Author: Andrew Ng
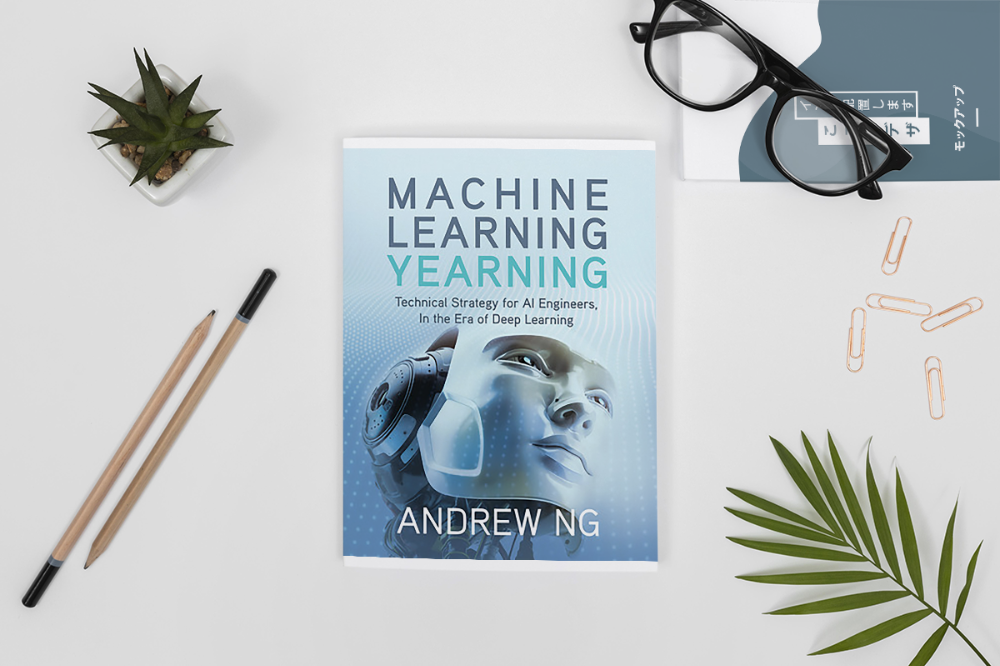
Andrew Ng is a machine learning expert. Co-founded and teaches at Stanford. This free book shows you how to structure an ML project, including recognizing mistakes and building in complex contexts.
The book delivers knowledge and teaches how to apply it, so you'll know how to:
Determine the optimal course of action for your ML project.
Create software that is more effective than people.
Recognize when to use end-to-end, transfer, and multi-task learning, and how to do so.
Identifying machine learning system flaws
Ng writes easy-to-read books. No rigorous math theory; just a terrific approach to understanding how to make technical machine learning decisions.
11. Deep Learning with PyTorch Step-by-Step
Author: Daniel Voigt Godoy
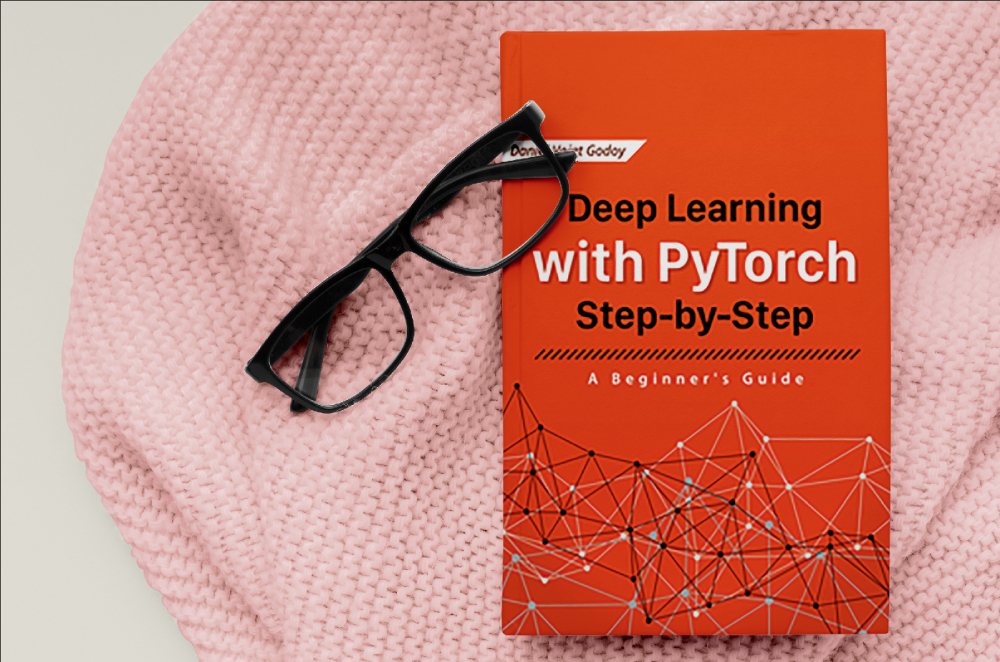
The last title is also the most recent. The book was revised on 23 January 2022 to discuss Deep Learning and PyTorch, a Python coding tool.
It comprises four parts:
Fundamentals (gradient descent, training linear and logistic regressions in PyTorch)
Machine Learning (deeper models and activation functions, convolutions, transfer learning, initialization schemes)
Sequences (RNN, GRU, LSTM, seq2seq models, attention, self-attention, transformers)
Automatic Language Recognition (tokenization, embeddings, contextual word embeddings, ELMo, BERT, GPT-2)
We admire the book's readability. The author avoids difficult mathematical concepts, making the material feel like a conversation.
Is every data scientist a humanist?
Even as a technological professional, you can't escape human interaction, especially with clients.
We hope these books will help you develop interpersonal skills.

Glorin Santhosh
3 years ago
In his final days, Steve Jobs sent an email to himself. What It Said Was This
An email capturing Steve Jobs's philosophy.

Steve Jobs may have been the most inspired and driven entrepreneur.
He worked on projects because he wanted to leave a legacy.
Steve Jobs' final email to himself encapsulated his philosophy.
After his death from pancreatic cancer in October 2011, Laurene Powell Jobs released the email. He was 56.
Read: Steve Jobs by Walter Isaacson (#BestSeller)
The Email:
September 2010 Steve Jobs email:
“I grow little of the food I eat, and of the little I do grow, I do not breed or perfect the seeds.” “I do not make my own clothing. I speak a language I did not invent or refine,” he continued. “I did not discover the mathematics I use… I am moved by music I did not create myself.”
Jobs ended his email by reflecting on how others created everything he uses.
He wrote:
“When I needed medical attention, I was helpless to help myself survive.”
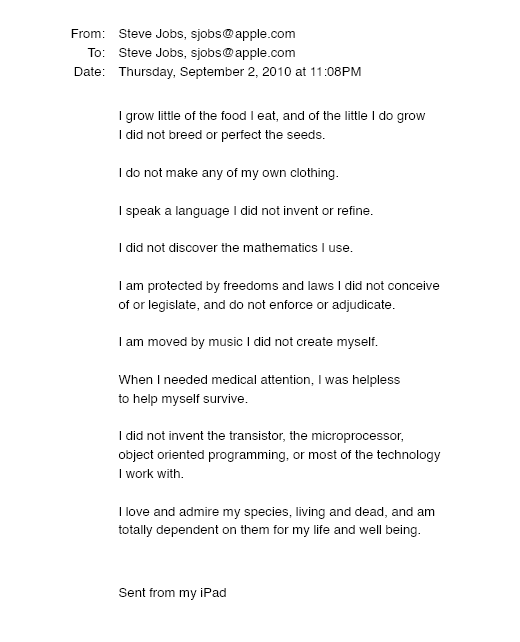
The Apple co-founder concluded by praising humanity.
“I did not invent the transistor, the microprocessor, object-oriented programming, or most of the technology I work with. I love and admire my species, living and dead, and am totally dependent on them for my life and well-being,” he concluded.
The email was made public as a part of the Steve Jobs Archive, a website that was launched in tribute to his legacy.
Steve Jobs' widow founded the internet archive. Apple CEO Tim Cook and former design leader Jony Ive were prominent guests.
Steve Jobs has always inspired because he shows how even the best can be improved.
High expectations were always there, and they were consistently met.
We miss him because he was one of the few with lifelong enthusiasm and persona.