


More on Productivity

Dr Mehmet Yildiz
3 years ago
How I train my brain daily for clarity and productivity.
I use a conceptual and practical system I developed decades ago as an example.
Since childhood, I've been interested in the brain-mind connection, so I developed a system using scientific breakthroughs, experiments, and the experiences of successful people in my circles.
This story provides a high-level overview of a custom system to inform and inspire readers. Creating a mind gym was one of my best personal and professional investments.
Such a complex system may not be possible for everyone or appear luxurious at first. However, the process and approach may help you find more accessible and viable solutions.
Visualizing the brain as a muscle, I learned to stimulate it with physical and mental exercises, applying a new mindset and behavioral changes.
My methods and practices may not work for others because we're all different. I focus on the approach's principles and highlights so you can create your own program.
Some create a conceptual and practical system intuitively, and others intellectually. Both worked. I see intellect and intuition as higher selves.
The mental tools I introduce are based on lifestyle changes and can be personalized by anyone, barring physical constraints or underlying health conditions.
Some people can't meditate despite wanting to due to mental constraints. This story lacks exceptions.
People's systems may vary. Many have used my tools successfully. All have scientific backing because their benefits attracted scientists. None are unethical or controversial.
My focus is cognition, which is the neocortex's ability. These practices and tools can affect the limbic and reptilian brain regions.
A previous article discussed brain health's biological aspects. This article focuses on psychology.
Thinking, learning, and remembering are cognitive abilities. Cognitive abilities determine our health and performance.
Cognitive health is the ability to think, concentrate, learn, and remember. Cognitive performance boosting involves various tools and processes. My system and protocols address cognitive health and performance.
As a biological organ, the brain's abilities decline with age, especially if not used regularly. Older people have more neurodegenerative disorders like dementia.
As aging is inevitable, I focus on creating cognitive reserves to remain mentally functional as we age and face mental decline or cognitive impairment.
My protocols focus on neurogenesis, or brain growth and maintenance. Neurons and connections can grow at any age.
Metacognition refers to knowing our cognitive abilities, like thinking about thinking and learning how to learn.
In the following sections, I provide an overview of my system, mental tools, and protocols.
This system summarizes my 50-year career. Some may find it too abstract, so I give examples.
First, explain the system. Section 2 introduces activities. Third, how to measure and maintain mental growth.
1 — Developed a practical mental gym.
The mental gym is a metaphor for the physical fitness gym to improve our mental muscles.
This concept covers brain and mind functionality. Integrated biological and psychological components.
I'll describe my mental gym so my other points make sense. My mental gym has physical and mental tools.
Mindfulness, meditation, visualization, self-conversations, breathing exercises, expressive writing, working in a flow state, reading, music, dance, isometric training, barefoot walking, cold/heat exposure, CBT, and social engagements are regular tools.
Dancing, walking, and thermogenesis are body-related tools. As the brain is part of the body and houses the mind, these tools can affect mental abilities such as attention, focus, memory, task switching, and problem-solving.
Different people may like different tools. I chose these tools based on my needs, goals, and lifestyle. They're just examples. You can choose tools that fit your goals and personality.
2 — Performed tasks regularly.
These tools gave me clarity. They became daily hobbies. Some I did alone, others with others.
Some examples: I meditate daily. Even though my overactive mind made daily meditation difficult at first, I now enjoy it. Meditation three times a day sharpens my mind.
Self-talk is used for self-therapy and creativity. Self-talk was initially difficult, but neurogenesis rewired my brain to make it a habit.
Cold showers, warm baths with Epsom salts, fasting, barefoot walks on the beach or grass, dancing, calisthenics, trampoline hopping, and breathing exercises increase my mental clarity, creativity, and productivity.
These exercises can increase BDNF, which promotes nervous system growth. They improve mental capacity and performance by increasing blood flow and brain oxygenation.
I use weekly and occasional activities like dry saunas, talking with others, and community activities.
These activities stimulate the brain and mind, improving performance and cognitive capacity.
3 — Measured progress, set growth goals.
Measuring progress helps us stay on track. Without data, it's hard to stay motivated. When we face inevitable setbacks, we may abandon our dreams.
I created a daily checklist for a spreadsheet with macros. I tracked how often and long I did each activity.
I measured my progress objectively and subjectively. In the progress spreadsheet, I noted my meditation hours and subjective feelings.
In another column, I used good, moderate, and excellent to get qualitative data. It took time and effort. Later, I started benefiting from this automated structure.
Creating a page for each activity, such as meditation, self-talk, cold showers, walking, expressive writing, personal interactions, etc., gave me empirical data I could analyze, modify, and graph to show progress.
Colored charts showed each area's strengths and weaknesses.
Strengths motivate me to continue them. Identifying weaknesses helped me improve them.
As the system matured, data recording became a habit and took less time. I saw the result immediately because I automated the charts when I entered daily data. Early time investment paid off later.
Mind Gym Benefits, Effective Use, and Progress Measuring
This concept helped me move from comfort to risk. I accept things as they are.
Turnarounds were made. I stopped feeling "Fight-Flight-Freeze" and maintained self-control.
I tamed my overactive amygdala by strengthening my brain. Stress and anxiety decreased. With these shifts, I accepted criticism and turned envy into admiration. Clarity improved.
When the cognitive part of the brain became stronger and the primitive part was tamed, managing thoughts and emotions became easier. My AQ increased. I learned to tolerate people, physical, mental, and emotional obstacles.
Accessing vast information sources in my subconscious mind through an improved RAS allowed me to easily tap into my higher self and recognize flaws in my lower self.
Summary
The brain loves patterns and routines, so habits help. Observing, developing, and monitoring habits mindfully can be beneficial. Mindfulness helps us achieve this goal systematically.
As body and mind are connected, we must consider both when building habits. Consistent and joyful practices can strengthen neurons and neural connections.
Habits help us accomplish more with less effort. Regularly using mental tools and processes can improve our cognitive health and performance as we age.
Creating daily habits to improve cognitive abilities can sharpen our minds and boost our well-being.
Some apps monitor our activities and behavior to help build habits. If you can't replicate my system, try these apps. Some smartwatches and fitness devices include them.
Set aside time each day for mental activities you enjoy. Regular scheduling and practice can strengthen brain regions and form habits. Once you form habits, tasks become easy.
Improving our minds is a lifelong journey. It's easier and more sustainable to increase our efforts daily, weekly, monthly, or annually.
Despite life's ups and downs, many want to remain calm and cheerful.
This valuable skill is unrelated to wealth or fame. It's about our mindset, fueled by our biological and psychological needs.
Here are some lessons I've learned about staying calm and composed despite challenges and setbacks.
1 — Tranquillity starts with observing thoughts and feelings.
2 — Clear the mental clutter and emotional entanglements with conscious breathing and gentle movements.
3 — Accept situations and events as they are with no resistance.
4 — Self-love can lead to loving others and increasing compassion.
5 — Count your blessings and cultivate gratitude.
Clear thinking can bring joy and satisfaction. It's a privilege to wake up with a healthy body and clear mind, ready to connect with others and serve them.
Thank you for reading my perspectives. I wish you a healthy and happy life.

Jari Roomer
3 years ago
Three Simple Daily Practices That Will Immediately Double Your Output
Most productive people are habitual.
Early in the day, do important tasks.
In his best-selling book Eat That Frog, Brian Tracy advised starting the day with your hardest, most important activity.
Most individuals work best in the morning. Energy and willpower peak then.
Mornings are also ideal for memory, focus, and problem-solving.
Thus, the morning is ideal for your hardest chores.
It makes sense to do these things during your peak performance hours.
Additionally, your morning sets the tone for the day. According to Brian Tracy, the first hour of the workday steers the remainder.
After doing your most critical chores, you may feel accomplished, confident, and motivated for the remainder of the day, which boosts productivity.
Develop Your Essentialism
In Essentialism, Greg McKeown claims that trying to be everything to everyone leads to mediocrity and tiredness.
You'll either burn out, be spread too thin, or compromise your ideals.
Greg McKeown advises Essentialism:
Clarify what’s truly important in your life and eliminate the rest.
Eliminating non-essential duties, activities, and commitments frees up time and energy for what matters most.
According to Greg McKeown, Essentialists live by design, not default.
You'll be happier and more productive if you follow your essentials.
Follow these three steps to live more essentialist.
Prioritize Your Tasks First
What matters most clarifies what matters less. List your most significant aims and values.
The clearer your priorities, the more you can focus on them.
On Essentialism, McKeown wrote, The ultimate form of effectiveness is the ability to deliberately invest our time and energy in the few things that matter most.
#2: Set Your Priorities in Order
Prioritize your priorities, not simply know them.
“If you don’t prioritize your life, someone else will.” — Greg McKeown
Planning each day and allocating enough time for your priorities is the best method to become more purposeful.
#3: Practice saying "no"
If a request or demand conflicts with your aims or principles, you must learn to say no.
Saying no frees up space for our priorities.
Place Sleep Above All Else
Many believe they must forego sleep to be more productive. This is false.
A productive day starts with a good night's sleep.
Matthew Walker (Why We Sleep) says:
“Getting a good night’s sleep can improve cognitive performance, creativity, and overall productivity.”
Sleep helps us learn, remember, and repair.
Unfortunately, 35% of people don't receive the recommended 79 hours of sleep per night.
Sleep deprivation can cause:
increased risk of diabetes, heart disease, stroke, and obesity
Depression, stress, and anxiety risk are all on the rise.
decrease in general contentment
decline in cognitive function
To live an ideal, productive, and healthy life, you must prioritize sleep.
Follow these six sleep optimization strategies to obtain enough sleep:
Establish a nightly ritual to relax and prepare for sleep.
Avoid using screens an hour before bed because the blue light they emit disrupts the generation of melatonin, a necessary hormone for sleep.
Maintain a regular sleep schedule to control your body's biological clock (and optimizes melatonin production)
Create a peaceful, dark, and cool sleeping environment.
Limit your intake of sweets and caffeine (especially in the hours leading up to bedtime)
Regular exercise (but not right before you go to bed, because your body temperature will be too high)
Sleep is one of the best ways to boost productivity.
Sleep is crucial, says Matthew Walker. It's the key to good health and longevity.

Leonardo Castorina
4 years ago
How to Use Obsidian to Boost Research Productivity
Tools for managing your PhD projects, reading lists, notes, and inspiration.
As a researcher, you have to know everything. But knowledge is useless if it cannot be accessed quickly. An easy-to-use method of archiving information makes taking notes effortless and enjoyable.
As a PhD student in Artificial Intelligence, I use Obsidian (https://obsidian.md) to manage my knowledge.
The article has three parts:
- What is a note, how to organize notes, tags, folders, and links? This section is tool-agnostic, so you can use most of these ideas with any note-taking app.
- Instructions for using Obsidian, managing notes, reading lists, and useful plugins. This section demonstrates how I use Obsidian, my preferred knowledge management tool.
- Workflows: How to use Zotero to take notes from papers, manage multiple projects' notes, create MOCs with Dataview, and more. This section explains how to use Obsidian to solve common scientific problems and manage/maintain your knowledge effectively.
This list is not perfect or complete, but it is my current solution to problems I've encountered during my PhD. Please leave additional comments or contact me if you have any feedback. I'll try to update this article.
Throughout the article, I'll refer to your digital library as your "Obsidian Vault" or "Zettelkasten".
Other useful resources are listed at the end of the article.
1. Philosophy: Taking and organizing notes
Carl Sagan: “To make an apple pie from scratch, you must first create the universe.”
Before diving into Obsidian, let's establish a Personal Knowledge Management System and a Zettelkasten. You can skip to Section 2 if you already know these terms.
Niklas Luhmann, a prolific sociologist who wrote 400 papers and 70 books, inspired this section and much of Zettelkasten. Zettelkasten means “slip box” (or library in this article). His Zettlekasten had around 90000 physical notes, which can be found here.
There are now many tools available to help with this process. Obsidian's website has a good introduction section: https://publish.obsidian.md/hub/
Notes
We'll start with "What is a note?" Although it may seem trivial, the answer depends on the topic or your note-taking style. The idea is that a note is as “atomic” (i.e. You should read the note and get the idea right away.
The resolution of your notes depends on their detail. Deep Learning, for example, could be a general description of Neural Networks, with a few notes on the various architectures (eg. Recurrent Neural Networks, Convolutional Neural Networks etc..).
Limiting length and detail is a good rule of thumb. If you need more detail in a specific section of this note, break it up into smaller notes. Deep Learning now has three notes:
- Deep Learning
- Recurrent Neural Networks
- Convolutional Neural Networks
Repeat this step as needed until you achieve the desired granularity. You might want to put these notes in a “Neural Networks” folder because they are all about the same thing. But there's a better way:
#Tags and [[Links]] over /Folders/
The main issue with folders is that they are not flexible and assume that all notes in the folder belong to a single category. This makes it difficult to make connections between topics.
Deep Learning has been used to predict protein structure (AlphaFold) and classify images (ImageNet). Imagine a folder structure like this:
- /Proteins/
- Protein Folding
- /Deep Learning/
- /Proteins/
Your notes about Protein Folding and Convolutional Neural Networks will be separate, and you won't be able to find them in the same folder.
This can be solved in several ways. The most common one is to use tags rather than folders. A note can be grouped with multiple topics this way. Obsidian tags can also be nested (have subtags).
You can also link two notes together. You can build your “Knowledge Graph” in Obsidian and other note-taking apps like Obsidian.
My Knowledge Graph. Green: Biology, Red: Machine Learning, Yellow: Autoencoders, Blue: Graphs, Brown: Tags.
My Knowledge Graph and the note “Backrpropagation” and its links.
Backpropagation note and all its links
Why use Folders?
Folders help organize your vault as it grows. The main suggestion is to have few folders that "weakly" collect groups of notes or better yet, notes from different sources.
Among my Zettelkasten folders are:
My Zettelkasten's 5 folders
They usually gather data from various sources:
MOC: Map of Contents for the Zettelkasten.
Projects: Contains one note for each side-project of my PhD where I log my progress and ideas. Notes are linked to these.
Bio and ML: These two are the main content of my Zettelkasten and could theoretically be combined.
Papers: All my scientific paper notes go here. A bibliography links the notes. Zotero .bib file
Books: I make a note for each book I read, which I then split into multiple notes.
Keeping images separate from other files can help keep your main folders clean.
I will elaborate on these in the Workflow Section.
My general recommendation is to use tags and links instead of folders.
Maps of Content (MOC)
Making Tables of Contents is a good solution (MOCs).
These are notes that "signposts" your Zettelkasten library, directing you to the right type of notes. It can link to other notes based on common tags. This is usually done with a title, then your notes related to that title. As an example:
An example of a Machine Learning MOC generated with Dataview.
As shown above, my Machine Learning MOC begins with the basics. Then it's on to Variational Auto-Encoders. Not only does this save time, but it also saves scrolling through the tag search section.
So I keep MOCs at the top of my library so I can quickly find information and see my library. These MOCs are generated automatically using an Obsidian Plugin called Dataview (https://github.com/blacksmithgu/obsidian-dataview).
Ideally, MOCs could be expanded to include more information about the notes, their status, and what's left to do. In the absence of this, Dataview does a fantastic job at creating a good structure for your notes.
In the absence of this, Dataview does a fantastic job at creating a good structure for your notes.
2. Tools: Knowing Obsidian
Obsidian is my preferred tool because it is free, all notes are stored in Markdown format, and each panel can be dragged and dropped. You can get it here: https://obsidian.md/
Obsidian interface.
Obsidian is highly customizable, so here is my preferred interface:
The theme is customized from https://github.com/colineckert/obsidian-things
Alternatively, each panel can be collapsed, moved, or removed as desired. To open a panel later, click on the vertical "..." (bottom left of the note panel).
My interface is organized as follows:
How my Obsidian Interface is organized.
Folders/Search:
This is where I keep all relevant folders. I usually use the MOC note to navigate, but sometimes I use the search button to find a note.
Tags:
I use nested tags and look into each one to find specific notes to link.
cMenu:
Easy-to-use menu plugin cMenu (https://github.com/chetachiezikeuzor/cMenu-Plugin)
Global Graph:
The global graph shows all your notes (linked and unlinked). Linked notes will appear closer together. Zoom in to read each note's title. It's a bit overwhelming at first, but as your library grows, you get used to the positions and start thinking of new connections between notes.
Local Graph:
Your current note will be shown in relation to other linked notes in your library. When needed, you can quickly jump to another link and back to the current note.
Links:
Finally, an outline panel and the plugin Obsidian Power Search (https://github.com/aviral-batra/obsidian-power-search) allow me to search my vault by highlighting text.
Start using the tool and worry about panel positioning later. I encourage you to find the best use-case for your library.
Plugins
An additional benefit of using Obsidian is the large plugin library. I use several (Calendar, Citations, Dataview, Templater, Admonition):
Obsidian Calendar Plugin: https://github.com/liamcain
It organizes your notes on a calendar. This is ideal for meeting notes or keeping a journal.
Calendar addon from hans/obsidian-citation-plugin
Obsidian Citation Plugin: https://github.com/hans/
Allows you to cite papers from a.bib file. You can also customize your notes (eg. Title, Authors, Abstract etc..)
Plugin citation from hans/obsidian-citation-plugin
Obsidian Dataview: https://github.com/blacksmithgu/
A powerful plugin that allows you to query your library as a database and generate content automatically. See the MOC section for an example.
Allows you to create notes with specific templates like dates, tags, and headings.
Templater. Obsidian Admonition: https://github.com/valentine195/obsidian-admonition
Blocks allow you to organize your notes.
Plugin warning. Obsidian Admonition (valentine195)
There are many more, but this list should get you started.
3. Workflows: Cool stuff
Here are a few of my workflows for using obsidian for scientific research. This is a list of resources I've found useful for my use-cases. I'll outline and describe them briefly so you can skim them quickly.
3.1 Using Templates to Structure Notes
3.2 Free Note Syncing (Laptop, Phone, Tablet)
3.3 Zotero/Mendeley/JabRef -> Obsidian — Managing Reading Lists
3.4 Projects and Lab Books
3.5 Private Encrypted Diary
3.1 Using Templates to Structure Notes
Plugins: Templater and Dataview (optional).
To take effective notes, you must first make adding new notes as easy as possible. Templates can save you time and give your notes a consistent structure. As an example:
An example of a note using a template.
### [[YOUR MOC]]
# Note Title of your note
**Tags**::
**Links**::
The top line links to your knowledge base's Map of Content (MOC) (see previous sections). After the title, I add tags (and a link between the note and the tag) and links to related notes.
To quickly identify all notes that need to be expanded, I add the tag “#todo”. In the “TODO:” section, I list the tasks within the note.
The rest are notes on the topic.
Templater can help you create these templates. For new books, I use the following template:
### [[Books MOC]]
# Title
**Author**::
**Date::
**Tags::
**Links::
A book template example.
Using a simple query, I can hook Dataview to it.
dataview
table author as Author, date as “Date Finished”, tags as “Tags”, grade as “Grade”
from “4. Books”
SORT grade DESCENDING
using Dataview to query templates.
3.2 Free Note Syncing (Laptop, Phone, Tablet)
No plugins used.
One of my favorite features of Obsidian is the library's self-contained and portable format. Your folder contains everything (plugins included).
Ordinary folders and documents are available as well. There is also a “.obsidian” folder. This contains all your plugins and settings, so you can use it on other devices.
So you can use Google Drive, iCloud, or Dropbox for free as long as you sync your folder (note: your folder should be in your Cloud Folder).
For my iOS and macOS work, I prefer iCloud. You can also use the paid service Obsidian Sync.
3.3 Obsidian — Managing Reading Lists and Notes in Zotero/Mendeley/JabRef
Plugins: Quotes (required).
3.3 Zotero/Mendeley/JabRef -> Obsidian — Taking Notes and Managing Reading Lists of Scientific Papers
My preferred reference manager is Zotero, but this workflow should work with any reference manager that produces a .bib file. This file is exported to my cloud folder so I can access it from any platform.
My Zotero library is tagged as follows:
My reference manager's tags
For readings, I usually search for the tags “!!!” and “To-Read” and select a paper. Annotate the paper next (either on PDF using GoodNotes or on physical paper).
Then I make a paper page using a template in the Citations plugin settings:
An example of my citations template.
Create a new note, open the command list with CMD/CTRL + P, and find the Citations “Insert literature note content in the current pane” to see this lovely view.
Citation generated by the article https://doi.org/10.1101/2022.01.24.22269144
You can then convert your notes to digital. I found that transcribing helped me retain information better.
3.4 Projects and Lab Books
Plugins: Tweaker (required).
PhD students offering advice on thesis writing are common (read as regret). I started asking them what they would have done differently or earlier.
“Deep stuff Leo,” one person said. So my main issue is basic organization, losing track of my tasks and the reasons for them.
As a result, I'd go on other experiments that didn't make sense, and have to reverse engineer my logic for thesis writing. - PhD student now wise Postdoc
Time management requires planning. Keeping track of multiple projects and lab books is difficult during a PhD. How I deal with it:
- One folder for all my projects
- One file for each project
I use a template to create each project
### [[Projects MOC]]
# <% tp.file.title %>
**Tags**::
**Links**::
**URL**::
**Project Description**::## Notes:
### <% tp.file.last_modified_date(“dddd Do MMMM YYYY”) %>
#### Done:
#### TODO:
#### Notes
You can insert a template into a new note with CMD + P and looking for the Templater option.
I then keep adding new days with another template:
### <% tp.file.last_modified_date("dddd Do MMMM YYYY") %>
#### Done:
#### TODO:
#### Notes:
This way you can keep adding days to your project and update with reasonings and things you still have to do and have done. An example below:
Example of project note with timestamped notes.
3.5 Private Encrypted Diary
This is one of my favorite Obsidian uses.
Mini Diary's interface has long frustrated me. After the author archived the project, I looked for a replacement. I had two demands:
- It had to be private, and nobody had to be able to read the entries.
- Cloud syncing was required for editing on multiple devices.
Then I learned about encrypting the Obsidian folder. Then decrypt and open the folder with Obsidian. Sync the folder as usual.
Use CryptoMator (https://cryptomator.org/). Create an encrypted folder in Cryptomator for your Obsidian vault, set a password, and let it do the rest.
If you need a step-by-step video guide, here it is:
Conclusion
So, I hope this was helpful!
In the first section of the article, we discussed notes and note-taking techniques. We discussed when to use tags and links over folders and when to break up larger notes.
Then we learned about Obsidian, its interface, and some useful plugins like Citations for citing papers and Templater for creating note templates.
Finally, we discussed workflows and how to use Zotero to take notes from scientific papers, as well as managing Lab Books and Private Encrypted Diaries.
Thanks for reading and commenting :)
Read original post here
You might also like

Jake Prins
3 years ago
What are NFTs 2.0 and what issues are they meant to address?
New standards help NFTs reach their full potential.
NFTs lack interoperability and functionality. They have great potential but are mostly speculative. To maximize NFTs, we need flexible smart contracts.
Current requirements are too restrictive.
Most NFTs are based on ERC-721, which makes exchanging them easy. CryptoKitties, a popular online game, used the 2017 standard to demonstrate NFTs' potential.
This simple standard includes a base URI and incremental IDs for tokens. Add the tokenID to the base URI to get the token's metadata.
This let creators collect NFTs. Many NFT projects store metadata on IPFS, a distributed storage network, but others use Google Drive. NFT buyers often don't realize that if the creators delete or move the files, their NFT is just a pointer.
This isn't the standard's biggest issue. There's no way to validate NFT projects.
Creators are one of the most important aspects of art, but nothing is stored on-chain.
ERC-721 contracts only have a name and symbol.
Most of the data on OpenSea's collection pages isn't from the NFT's smart contract. It was added through a platform input field, so it's in the marketplace's database. Other websites may have different NFT information.
In five years, your NFT will be just a name, symbol, and ID.
Your NFT doesn't mention its creators. Although the smart contract has a public key, it doesn't reveal who created it.
The NFT's creators and their reputation are crucial to its value. Think digital fashion and big brands working with well-known designers when more professionals use NFTs. Don't you want them in your NFT?
Would paintings be as valuable if their artists were unknown? Would you believe it's real?
Buying directly from an on-chain artist would reduce scams. Current standards don't allow this data.
Most creator profiles live on centralized marketplaces and could disappear. Current platforms have outpaced underlying standards. The industry's standards are lagging.
For NFTs to grow beyond pointers to a monkey picture file, we may need to use new Web3-based standards.
Introducing NFTs 2.0
Fabian Vogelsteller, creator of ERC-20, developed new web3 standards. He proposed LSP7 Digital Asset and LSP8 Identifiable Digital Asset, also called NFT 2.0.
NFT and token metadata inputs are extendable. Changes to on-chain metadata inputs allow NFTs to evolve. Instead of public keys, the contract can have Universal Profile addresses attached. These profiles show creators' faces and reputations. NFTs can notify asset receivers, automating smart contracts.
LSP7 and LSP8 use ERC725Y. Using a generic data key-value store gives contracts much-needed features:
The asset can be customized and made to stand out more by allowing for unlimited data attachment.
Recognizing changes to the metadata
using a hash reference for metadata rather than a URL reference
This base will allow more metadata customization and upgradeability. These guidelines are:
Genuine and Verifiable Now, the creation of an NFT by a specific Universal Profile can be confirmed by smart contracts.
Dynamic NFTs can update Flexible & Updatable Metadata, allowing certain things to evolve over time.
Protected metadata Now, secure metadata that is readable by smart contracts can be added indefinitely.
Better NFTS prevent the locking of NFTs by only being sent to Universal Profiles or a smart contract that can interact with them.
Summary
NFTS standards lack standardization and powering features, limiting the industry.
ERC-721 is the most popular NFT standard, but it only represents incremental tokenIDs without metadata or asset representation. No standard sender-receiver interaction or security measures ensure safe asset transfers.
NFT 2.0 refers to the new LSP7-DigitalAsset and LSP8-IdentifiableDigitalAsset standards.
They have new standards for flexible metadata, secure transfers, asset representation, and interactive transfer.
With NFTs 2.0 and Universal Profiles, creators could build on-chain reputations.
NFTs 2.0 could bring the industry's needed innovation if it wants to move beyond trading profile pictures for speculation.
Laura Sanders
4 years ago
Xenobots, tiny living machines, can duplicate themselves.
Strange and complex behavior of frog cell blobs
A xenobot “parent,” shaped like a hungry Pac-Man (shown in red false color), created an “offspring” xenobot (green sphere) by gathering loose frog cells in its opening.
Tiny “living machines” made of frog cells can make copies of themselves. This newly discovered renewal mechanism may help create self-renewing biological machines.
According to Kirstin Petersen, an electrical and computer engineer at Cornell University who studies groups of robots, “this is an extremely exciting breakthrough.” She says self-replicating robots are a big step toward human-free systems.
Researchers described the behavior of xenobots earlier this year (SN: 3/31/21). Small clumps of skin stem cells from frog embryos knitted themselves into small spheres and started moving. Cilia, or cellular extensions, powered the xenobots around their lab dishes.
The findings are published in the Proceedings of the National Academy of Sciences on Dec. 7. The xenobots can gather loose frog cells into spheres, which then form xenobots.
The researchers call this type of movement-induced reproduction kinematic self-replication. The study's coauthor, Douglas Blackiston of Tufts University in Medford, Massachusetts, and Harvard University, says this is typical. For example, sexual reproduction requires parental sperm and egg cells. Sometimes cells split or budded off from a parent.
“This is unique,” Blackiston says. These xenobots “find loose parts in the environment and cobble them together.” This second generation of xenobots can move like their parents, Blackiston says.
The researchers discovered that spheroid xenobots could only produce one more generation before dying out. The original xenobots' shape was predicted by an artificial intelligence program, allowing for four generations of replication.
A C shape, like an openmouthed Pac-Man, was predicted to be a more efficient progenitor. When improved xenobots were let loose in a dish, they began scooping up loose cells into their gaping “mouths,” forming more sphere-shaped bots (see image below). As many as 50 cells clumped together in the opening of a parent to form a mobile offspring. A xenobot is made up of 4,000–6,000 frog cells.
Petersen likes the Xenobots' small size. “The fact that they were able to do this at such a small scale just makes it even better,” she says. Miniature xenobots could sculpt tissues for implantation or deliver therapeutics inside the body.
Beyond the xenobots' potential jobs, the research advances an important science, says study coauthor and Tufts developmental biologist Michael Levin. The science of anticipating and controlling the outcomes of complex systems, he says.
“No one could have predicted this,” Levin says. “They regularly surprise us.” Researchers can use xenobots to test the unexpected. “This is about advancing the science of being less surprised,” Levin says.

Sammy Abdullah
3 years ago
Payouts to founders at IPO
How much do startup founders make after an IPO? We looked at 2018's major tech IPOs. Paydays aren't what founders took home at the IPO (shares are normally locked up for 6 months), but what they were worth at the IPO price on the day the firm went public. It's not cash, but it's nice. Here's the data.
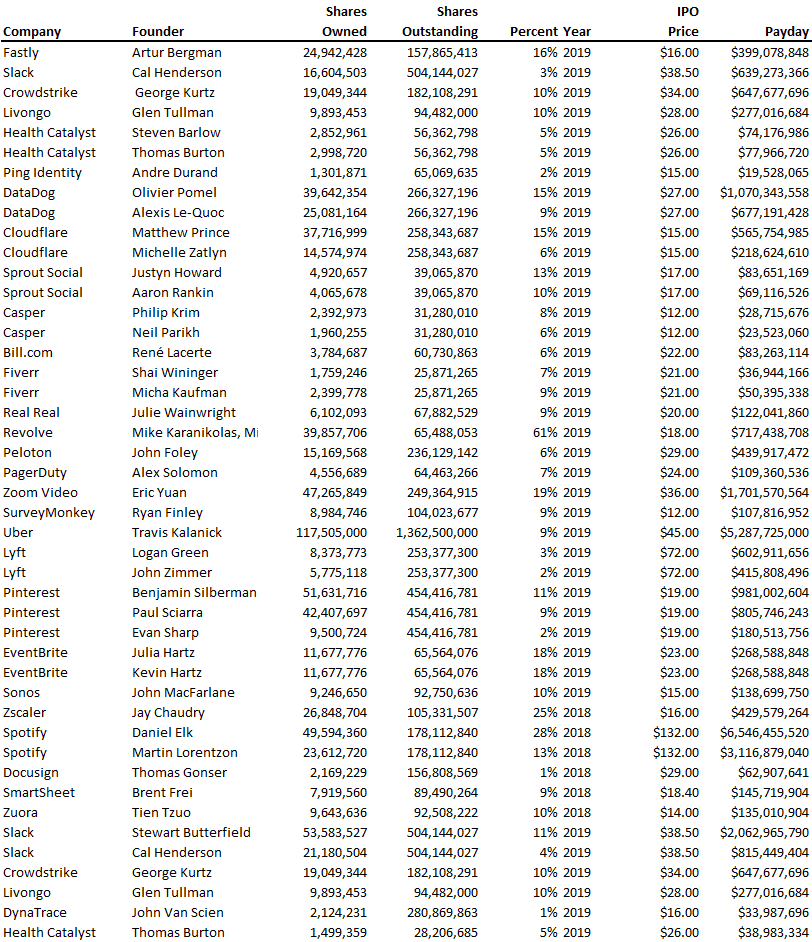
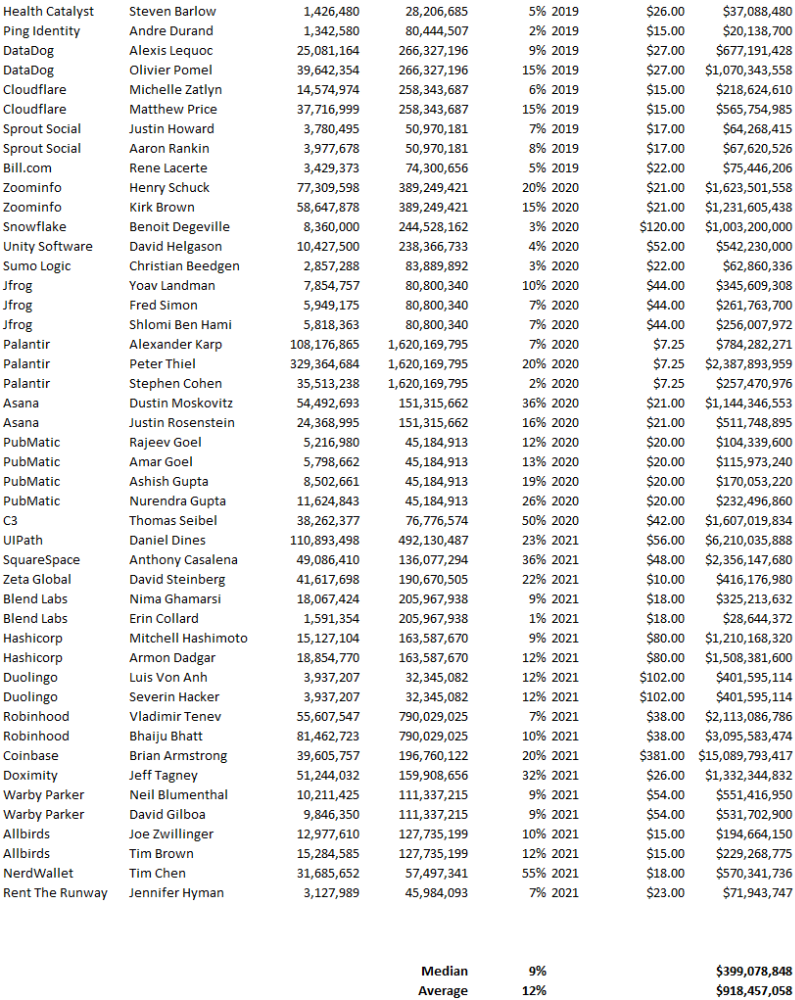
Several points are noteworthy.
Huge payoffs. Median and average pay were $399m and $918m. Average and median homeownership were 9% and 12%.
Coinbase, Uber, UI Path. Uber, Zoom, Spotify, UI Path, and Coinbase founders raised billions. Zoom's founder owned 19% and Spotify's 28% and 13%. Brian Armstrong controlled 20% of Coinbase at IPO and was worth $15bn. Preserving as much equity as possible by staying cash-efficient or raising at high valuations also helps.
The smallest was Ping. Ping's compensation was the smallest. Andre Duand owned 2% but was worth $20m at IPO. That's less than some billion-dollar paydays, but still good.
IPOs can be lucrative, as you can see. Preserving equity could be the difference between a $20mm and $15bln payday (Coinbase).