


Day Trading Introduction
Historically, only large financial institutions, brokerages, and trading houses could actively trade in the stock market. With instant global news dissemination and low commissions, developments such as discount brokerages and online trading have leveled the playing—or should we say trading—field. It's never been easier for retail investors to trade like pros thanks to trading platforms like Robinhood and zero commissions.
Day trading is a lucrative career (as long as you do it properly). But it can be difficult for newbies, especially if they aren't fully prepared with a strategy. Even the most experienced day traders can lose money.
So, how does day trading work?
Day Trading Basics
Day trading is the practice of buying and selling a security on the same trading day. It occurs in all markets, but is most common in forex and stock markets. Day traders are typically well educated and well funded. For small price movements in highly liquid stocks or currencies, they use leverage and short-term trading strategies.
Day traders are tuned into short-term market events. News trading is a popular strategy. Scheduled announcements like economic data, corporate earnings, or interest rates are influenced by market psychology. Markets react when expectations are not met or exceeded, usually with large moves, which can help day traders.
Intraday trading strategies abound. Among these are:
- Scalping: This strategy seeks to profit from minor price changes throughout the day.
- Range trading: To determine buy and sell levels, range traders use support and resistance levels.
- News-based trading exploits the increased volatility around news events.
- High-frequency trading (HFT): The use of sophisticated algorithms to exploit small or short-term market inefficiencies.
A Disputed Practice
Day trading's profit potential is often debated on Wall Street. Scammers have enticed novices by promising huge returns in a short time. Sadly, the notion that trading is a get-rich-quick scheme persists. Some daytrade without knowledge. But some day traders succeed despite—or perhaps because of—the risks.
Day trading is frowned upon by many professional money managers. They claim that the reward rarely outweighs the risk. Those who day trade, however, claim there are profits to be made. Profitable day trading is possible, but it is risky and requires considerable skill. Moreover, economists and financial professionals agree that active trading strategies tend to underperform passive index strategies over time, especially when fees and taxes are factored in.
Day trading is not for everyone and is risky. It also requires a thorough understanding of how markets work and various short-term profit strategies. Though day traders' success stories often get a lot of media attention, keep in mind that most day traders are not wealthy: Many will fail, while others will barely survive. Also, while skill is important, bad luck can sink even the most experienced day trader.
Characteristics of a Day Trader
Experts in the field are typically well-established professional day traders.
They usually have extensive market knowledge. Here are some prerequisites for successful day trading.
Market knowledge and experience
Those who try to day-trade without understanding market fundamentals frequently lose. Day traders should be able to perform technical analysis and read charts. Charts can be misleading if not fully understood. Do your homework and know the ins and outs of the products you trade.
Enough capital
Day traders only use risk capital they can lose. This not only saves them money but also helps them trade without emotion. To profit from intraday price movements, a lot of capital is often required. Most day traders use high levels of leverage in margin accounts, and volatile market swings can trigger large margin calls on short notice.
Strategy
A trader needs a competitive advantage. Swing trading, arbitrage, and trading news are all common day trading strategies. They tweak these strategies until they consistently profit and limit losses.
Strategy Breakdown:
Type | Risk | Reward
Swing Trading | High | High
Arbitrage | Low | Medium
Trading News | Medium | Medium
Mergers/Acquisitions | Medium | High
Discipline
A profitable strategy is useless without discipline. Many day traders lose money because they don't meet their own criteria. “Plan the trade and trade the plan,” they say. Success requires discipline.
Day traders profit from market volatility. For a day trader, a stock's daily movement is appealing. This could be due to an earnings report, investor sentiment, or even general economic or company news.
Day traders also prefer highly liquid stocks because they can change positions without affecting the stock's price. Traders may buy a stock if the price rises. If the price falls, a trader may decide to sell short to profit.
A day trader wants to trade a stock that moves (a lot).
Day Trading for a Living
Professional day traders can be self-employed or employed by a larger institution.
Most day traders work for large firms like hedge funds and banks' proprietary trading desks. These traders benefit from direct counterparty lines, a trading desk, large capital and leverage, and expensive analytical software (among other advantages). By taking advantage of arbitrage and news events, these traders can profit from less risky day trades before individual traders react.
Individual traders often manage other people’s money or simply trade with their own. They rarely have access to a trading desk, but they frequently have strong ties to a brokerage (due to high commissions) and other resources. However, their limited scope prevents them from directly competing with institutional day traders. Not to mention more risks. Individuals typically day trade highly liquid stocks using technical analysis and swing trades, with some leverage.
Day trading necessitates access to some of the most complex financial products and services. Day traders usually need:
Access to a trading desk
Traders who work for large institutions or manage large sums of money usually use this. The trading or dealing desk provides these traders with immediate order execution, which is critical during volatile market conditions. For example, when an acquisition is announced, day traders interested in merger arbitrage can place orders before the rest of the market.
News sources
The majority of day trading opportunities come from news, so being the first to know when something significant happens is critical. It has access to multiple leading newswires, constant news coverage, and software that continuously analyzes news sources for important stories.
Analytical tools
Most day traders rely on expensive trading software. Technical traders and swing traders rely on software more than news. This software's features include:
-
Automatic pattern recognition: It can identify technical indicators like flags and channels, or more complex indicators like Elliott Wave patterns.
-
Genetic and neural applications: These programs use neural networks and genetic algorithms to improve trading systems and make more accurate price predictions.
-
Broker integration: Some of these apps even connect directly to the brokerage, allowing for instant and even automatic trade execution. This reduces trading emotion and improves execution times.
-
Backtesting: This allows traders to look at past performance of a strategy to predict future performance. Remember that past results do not always predict future results.
Together, these tools give traders a competitive advantage. It's easy to see why inexperienced traders lose money without them. A day trader's earnings potential is also affected by the market in which they trade, their capital, and their time commitment.
Day Trading Risks
Day trading can be intimidating for the average investor due to the numerous risks involved. The SEC highlights the following risks of day trading:
Because day traders typically lose money in their first months of trading and many never make profits, they should only risk money they can afford to lose.
Trading is a full-time job that is stressful and costly: Observing dozens of ticker quotes and price fluctuations to spot market trends requires intense concentration. Day traders also spend a lot on commissions, training, and computers.
Day traders heavily rely on borrowing: Day-trading strategies rely on borrowed funds to make profits, which is why many day traders lose everything and end up in debt.
Avoid easy profit promises: Avoid “hot tips” and “expert advice” from day trading newsletters and websites, and be wary of day trading educational seminars and classes.
Should You Day Trade?
As stated previously, day trading as a career can be difficult and demanding.
- First, you must be familiar with the trading world and know your risk tolerance, capital, and goals.
- Day trading also takes a lot of time. You'll need to put in a lot of time if you want to perfect your strategies and make money. Part-time or whenever isn't going to cut it. You must be fully committed.
- If you decide trading is for you, remember to start small. Concentrate on a few stocks rather than jumping into the market blindly. Enlarging your trading strategy can result in big losses.
- Finally, keep your cool and avoid trading emotionally. The more you can do that, the better. Keeping a level head allows you to stay focused and on track.
If you follow these simple rules, you may be on your way to a successful day trading career.
Is Day Trading Illegal?
Day trading is not illegal or unethical, but it is risky. Because most day-trading strategies use margin accounts, day traders risk losing more than they invest and becoming heavily in debt.
How Can Arbitrage Be Used in Day Trading?
Arbitrage is the simultaneous purchase and sale of a security in multiple markets to profit from small price differences. Because arbitrage ensures that any deviation in an asset's price from its fair value is quickly corrected, arbitrage opportunities are rare.
Why Don’t Day Traders Hold Positions Overnight?
Day traders rarely hold overnight positions for several reasons: Overnight trades require more capital because most brokers require higher margin; stocks can gap up or down on overnight news, causing big trading losses; and holding a losing position overnight in the hope of recovering some or all of the losses may be against the trader's core day-trading philosophy.
What Are Day Trader Margin Requirements?
Regulation D requires that a pattern day trader client of a broker-dealer maintain at all times $25,000 in equity in their account.
How Much Buying Power Does Day Trading Have?
Buying power is the total amount of funds an investor has available to trade securities. FINRA rules allow a pattern day trader to trade up to four times their maintenance margin excess as of the previous day's close.
The Verdict
Although controversial, day trading can be a profitable strategy. Day traders, both institutional and retail, keep the markets efficient and liquid. Though day trading is still popular among novice traders, it should be left to those with the necessary skills and resources.
More on Economics & Investing

Sam Hickmann
3 years ago
What is headline inflation?
Headline inflation is the raw Consumer price index (CPI) reported monthly by the Bureau of labour statistics (BLS). CPI measures inflation by calculating the cost of a fixed basket of goods. The CPI uses a base year to index the current year's prices.
Explaining Inflation
As it includes all aspects of an economy that experience inflation, headline inflation is not adjusted to remove volatile figures. Headline inflation is often linked to cost-of-living changes, which is useful for consumers.
The headline figure doesn't account for seasonality or volatile food and energy prices, which are removed from the core CPI. Headline inflation is usually annualized, so a monthly headline figure of 4% inflation would equal 4% inflation for the year if repeated for 12 months. Top-line inflation is compared year-over-year.
Inflation's downsides
Inflation erodes future dollar values, can stifle economic growth, and can raise interest rates. Core inflation is often considered a better metric than headline inflation. Investors and economists use headline and core results to set growth forecasts and monetary policy.
Core Inflation
Core inflation removes volatile CPI components that can distort the headline number. Food and energy costs are commonly removed. Environmental shifts that affect crop growth can affect food prices outside of the economy. Political dissent can affect energy costs, such as oil production.
From 1957 to 2018, the U.S. averaged 3.64 percent core inflation. In June 1980, the rate reached 13.60%. May 1957 had 0% inflation. The Fed's core inflation target for 2022 is 3%.
Central bank:
A central bank has privileged control over a nation's or group's money and credit. Modern central banks are responsible for monetary policy and bank regulation. Central banks are anti-competitive and non-market-based. Many central banks are not government agencies and are therefore considered politically independent. Even if a central bank isn't government-owned, its privileges are protected by law. A central bank's legal monopoly status gives it the right to issue banknotes and cash. Private commercial banks can only issue demand deposits.
What are living costs?
The cost of living is the amount needed to cover housing, food, taxes, and healthcare in a certain place and time. Cost of living is used to compare the cost of living between cities and is tied to wages. If expenses are higher in a city like New York, salaries must be higher so people can live there.
What's U.S. bureau of labor statistics?
BLS collects and distributes economic and labor market data about the U.S. Its reports include the CPI and PPI, both important inflation measures.

Cory Doctorow
3 years ago
The current inflation is unique.
New Stiglitz just dropped.
Here's the inflation story everyone believes (warning: it's false): America gave the poor too much money during the recession, and now the economy is awash with free money, which made them so rich they're refusing to work, meaning the economy isn't making anything. Prices are soaring due to increased cash and missing labor.
Lawrence Summers says there's only one answer. We must impoverish the poor: raise interest rates, cause a recession, and eliminate millions of jobs, until the poor are stripped of their underserved fortunes and return to work.
https://pluralistic.net/2021/11/20/quiet-part-out-loud/#profiteering
This is nonsense. Countries around the world suffered inflation during and after lockdowns, whether they gave out humanitarian money to keep people from starvation. America has slightly greater inflation than other OECD countries, but it's not due to big relief packages.
The Causes of and Responses to Today's Inflation, a Roosevelt Institute report by Nobel-winning economist Joseph Stiglitz and macroeconomist Regmi Ira, debunks this bogus inflation story and offers a more credible explanation for inflation.
https://rooseveltinstitute.org/wp-content/uploads/2022/12/RI CausesofandResponsestoTodaysInflation Report 202212.pdf
Sharp interest rate hikes exacerbate the slump and increase inflation, the authors argue. They compare monetary policy inflation cures to medieval bloodletting, where doctors repeated the same treatment until the patient recovered (for which they received credit) or died (which was more likely).
Let's discuss bloodletting. Inflation hawks warn of the wage price spiral, when inflation rises and powerful workers bargain for higher pay, driving up expenses, prices, and wages. This is the fairy-tale narrative of the 1970s, and it's true except that OPEC's embargo drove up oil prices, which produced inflation. Oh well.
Let's be generous to seventies-haunted inflation hawks and say we're worried about a wage-price spiral. Fantastic! No. Real wages are 2.3% lower than they were in Oct 2021 after peaking in June at 4.8%.
Why did America's powerful workers take a paycut rather than demand inflation-based pay? Weak unions, globalization, economic developments.
Workers don't expect inflation to rise, so they're not requesting inflationary hikes. Inflationary expectations have remained moderate, consistent with our data interpretation.
https://www.newyorkfed.org/microeconomics/sce#/
Neither are workers. Working people see surplus savings as wealth and spend it gradually over their lives, despite rising demand. People may have saved money by staying in during the lockdown, but they don't eat out every night to make up for it. Instead, they keep those savings as precautionary balances. This is why the economy is lagging.
People don't buy non-traded goods with pandemic savings (basically, imports). Imports don't multiply like domestic purchases. If you buy a loaf of bread from the corner baker for $1 and they spend it at the tavern across the street, that dollar generates $3 in economic activity. Spending a dollar on foreign goods leaves the country and any multiplier effect happens there, not in the US.
Only marginally higher wages. The ECI is up 1.6% from 2019. Almost all gains went to the 25% lowest-paid Americans. Contrary to the inflation worry about too much savings, these workers don't make enough to save, even post-pandemic.
Recreation and transit spending are at or below pre-pandemic levels. Higher food and hotel prices (which doesn’t mean we’re buying more food than we were in 2019, just that it costs more).
What causes inflation if not greedy workers, free money, and high demand? The most expensive domestic goods produce the biggest revenues for their manufacturers. They charge you more without paying their workers or suppliers more.
The largest price-gougers are funneling their earnings to rich people who store it offshore through stock buybacks and dividends. A $1 billion stock buyback doesn't buy $1 billion in bread.
Five factors influence US inflation today:
I. Price rises for energy and food
II. shifts in consumer tastes
III. supply interruptions (mainly autos);
IV. increased rents (due to telecommuting);
V. monopoly (AKA price-gouging).
None can be remedied by raising interest rates or laying off workers.
Russia's invasion of Ukraine, omicron, and China's Zero Covid policy all disrupted the flow of food, energy, and production inputs. The price went higher because we made less.
After Russia invaded Ukraine, oil prices spiked, and sanctions made it worse. But that was February. By October, oil prices had returned to pre-pandemic, 2015 levels attributable to global economic adjustments, including a shift to renewables. Every new renewable installation reduces oil consumption and affects oil prices.
High food prices have a simple solution. The US and EU have bribed farmers not to produce for 50 years. If the war continues, this program may end, and food prices may decline.
Demand changes. We want different things than in 2019, not more. During the lockdown, people substituted goods. Half of the US toilet-paper supply in 2019 was on commercial-sized rolls. This is created from different mills and stock than our toilet paper.
Lockdown pushed toilet paper demand to residential rolls, causing shortages (the TP hoarding story was just another pandemic urban legend). Because supermarket stores don't have accounts with commercial paper distributors, ordering from languishing stores was difficult. Kleenex and paper towel substitutions caused greater shortages.
All that drove increased costs in numerous product categories, and there were more cases. These increases are transient, caused by supply chain inefficiencies that are resolving.
Demand for frontline staff saw a one-time repricing of pay, which is being recouped as we speak.
Illnesses. Brittle, hollowed-out global supply chains aggravated this. The constant pursuit of cheap labor and minimal regulation by monopolies that dominate most sectors means things are manufactured in far-flung locations. Financialization means any surplus capital assets were sold off years ago, leaving firms with little production slack. After the epidemic, several of these systems took years to restart.
Automobiles are to blame. Financialization and monopolization consolidated microchip and auto production in Taiwan and China. When the lockdowns came, these worldwide corporations cancelled their chip orders, and when they placed fresh orders, they were at the back of the line.
That drove up car prices, which is why the US has slightly higher inflation than other wealthy countries: the economy is car-centric. Automobile prices account for 9% of the CPI. France: 3.6%
Rent shocks and telecommuting. After the epidemic, many professionals moved to exurbs, small towns, and the countryside to work from home. As commercial properties were vacated, it was impractical to adapt them for residential use due to planning restrictions. Addressing these restrictions will cut rent prices more than raising inflation rates, which halts housing construction.
Statistical mirages cause some rent inflation. The CPI estimates what homeowners would pay to rent their properties. When rents rise in your neighborhood, the CPI believes you're spending more on rent even if you have a 30-year fixed-rate mortgage.
Market dominance. Almost every area of the US economy is dominated by monopolies, whose CEOs disclose on investor calls that they use inflation scares to jack up prices and make record profits.
https://pluralistic.net/2022/02/02/its-the-economy-stupid/#overinflated
Long-term profit margins are rising. Markups averaged 26% from 1960-1980. 2021: 72%. Market concentration explains 81% of markup increases (e.g. monopolization). Profit margins reach a 70-year high in 2022. These elements interact. Monopolies thin out their sectors, making them brittle and sensitive to shocks.
If we're worried about a shrinking workforce, there are more humanitarian and sensible solutions than causing a recession and mass unemployment. Instead, we may boost US production capacity by easing workers' entry into the workforce.
https://pluralistic.net/2022/06/01/factories-to-condos-pipeline/#stuff-not-money
US female workforce participation ranks towards the bottom of developed countries. Many women can't afford to work due to America's lack of daycare, low earnings, and bad working conditions in female-dominated fields. If America doesn't have enough workers, childcare subsidies and minimum wages can help.
By contrast, driving the country into recession with interest-rate hikes will reduce employment, and the last recruited (women, minorities) are the first fired and the last to be rehired. Forcing America into recession won't enhance its capacity to create what its people want; it will degrade it permanently.
Nothing the Fed does can stop price hikes from international markets, lack of supply chain investment, COVID-19 disruptions, climate change, the Ukraine war, or market power. They can worsen it. When supply problems generate inflation, raising interest rates decreases investments that can remedy shortages.
Increasing interest rates won't cut rents since landlords pass on the expenses and high rates restrict investment in new dwellings where tenants could escape the costs.
Fixing the supply fixes supply-side inflation. Increase renewables investment (as the Inflation Reduction Act does). Monopolies can be busted (as the IRA does). Reshore key goods (as the CHIPS Act does). Better pay and child care attract employees.
Windfall taxes can claw back price-gouging corporations' monopoly earnings.
https://pluralistic.net/2022/03/15/sanctions-financing/#soak-the-rich
In 2008, we ruled out fiscal solutions (bailouts for debtors) and turned to monetary policy (bank bailouts). This preserved the economy but increased inequality and eroded public trust.
Monetary policy won't help. Even monetary policy enthusiasts recognize an 18-month lag between action and result. That suggests monetary tightening is unnecessary. Like the medieval bloodletter, central bankers whose interest rate hikes don't work swiftly may do more of the same, bringing the economy to its knees.
Interest rates must rise. Zero-percent interest fueled foolish speculation and financialization. Increasing rates will stop this. Increasing interest rates will destroy the economy and dampen inflation.
Then what? All recent evidence indicate to inflation decreasing on its own, as the authors argue. Supply side difficulties are finally being overcome, evidence shows. Energy and food prices are showing considerable mean reversion, which is disinflationary.
The authors don't recommend doing nothing. Best case scenario, they argue, is that the Fed won't keep raising interest rates until morale improves.

Cody Collins
3 years ago
The direction of the economy is as follows.
What quarterly bank earnings reveal

Big banks know the economy best. Unless we’re talking about a housing crisis in 2007…
Banks are crucial to the U.S. economy. The Fed, communities, and investments exchange money.
An economy depends on money flow. Banks' views on the economy can affect their decision-making.
Most large banks released quarterly earnings and forward guidance last week. Others were pessimistic about the future.
What Makes Banks Confident
Bank of America's profit decreased 30% year-over-year, but they're optimistic about the economy. Comparatively, they're bullish.
Who banks serve affects what they see. Bank of America supports customers.
They think consumers' future is bright. They believe this for many reasons.
The average customer has decent credit, unless the system is flawed. Bank of America's new credit card and mortgage borrowers averaged 771. New-car loan and home equity borrower averages were 791 and 797.
2008's housing crisis affected people with scores below 620.
Bank of America and the economy benefit from a robust consumer. Major problems can be avoided if individuals maintain spending.
Reasons Other Banks Are Less Confident
Spending requires income. Many companies, mostly in the computer industry, have announced they will slow or freeze hiring. Layoffs are frequently an indication of poor times ahead.
BOA is positive, but investment banks are bearish.
Jamie Dimon, CEO of JPMorgan, outlined various difficulties our economy could confront.
But geopolitical tension, high inflation, waning consumer confidence, the uncertainty about how high rates have to go and the never-before-seen quantitative tightening and their effects on global liquidity, combined with the war in Ukraine and its harmful effect on global energy and food prices are very likely to have negative consequences on the global economy sometime down the road.
That's more headwinds than tailwinds.
JPMorgan, which helps with mergers and IPOs, is less enthusiastic due to these concerns. Incoming headwinds signal drying liquidity, they say. Less business will be done.
Final Reflections
I don't think we're done. Yes, stocks are up 10% from a month ago. It's a long way from old highs.
I don't think the stock market is a strong economic indicator.
Many executives foresee a 2023 recession. According to the traditional definition, we may be in a recession when Q2 GDP statistics are released next week.
Regardless of criteria, I predict the economy will have a terrible year.
Weekly layoffs are announced. Inflation persists. Will prices return to 2020 levels if inflation cools? Perhaps. Still expensive energy. Ukraine's war has global repercussions.
I predict BOA's next quarter earnings won't be as bullish about the consumer's strength.
You might also like

caroline sinders
3 years ago
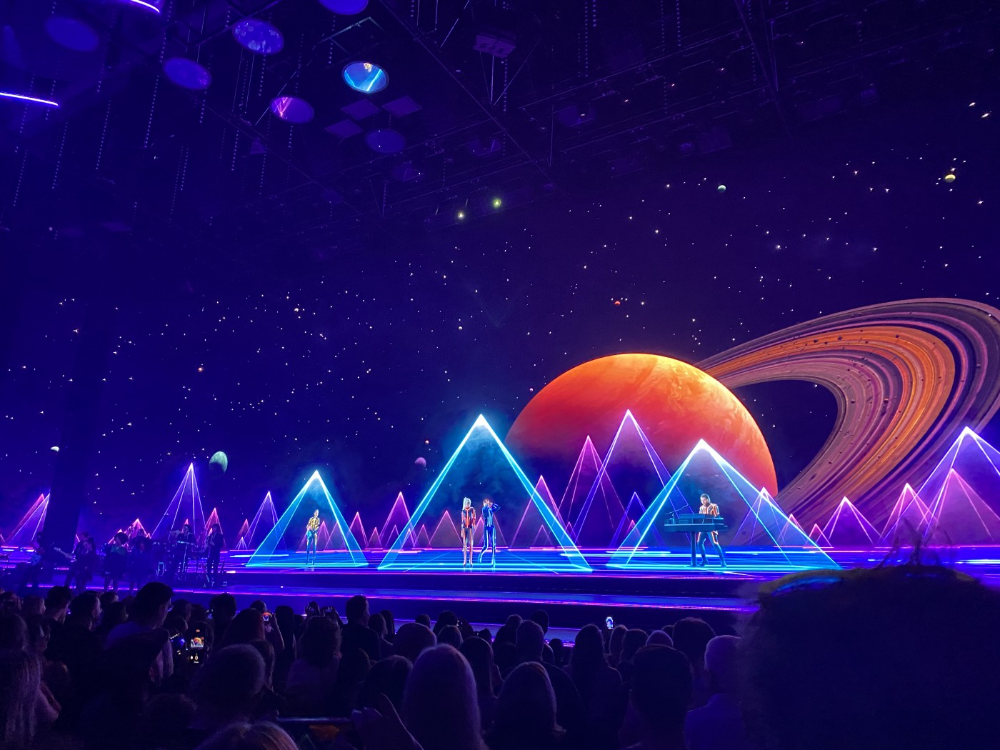
Holographic concerts are the AI of the Future.

A few days ago, I was discussing dall-e with two art and tech pals. One artist acquaintance said she knew a frightened illustrator. Would the ability to create anything with a click derail her career? The artist feared this. My curator friend smiled and said this has always been a dread among artists. When the camera was invented, didn't painters say this? Even in the Instagram era, painting exists.
When art and technology collide, there's room for innovation, experimentation, and fear — especially if the technology replicates or replaces art making. What is art's future with dall-e? How does technology affect music, beyond visual art? Recently, I saw "ABBA Voyage," a holographic ABBA concert in London.
"Abba voyage?" my phone asked in early March. A Gen X friend I met through a fashion blogging ring texted me.
"What's abba Voyage?" I asked while opening my front door with keys and coffee.
We're going! Marti, visiting London, took me to a show.
"Absolutely no ABBA songs here." I responded.
My parents didn't play ABBA much, so I don't know much about them. Dad liked Jimi Hendrix, Cream, Deep Purple, and New Orleans jazz. Marti told me ABBA Voyage was a holographic ABBA show with a live band.
The show was fun, extraordinary fun. Nearly everyone on the dance floor wore wigs, ankle-breaking platforms, sequins, and bellbottoms. I saw some millennials and Zoomers among the boomers.
I was intoxicated by the experience.
Automatons date back to the 18th-century mechanical turk. The mechanical turk was a chess automaton operated by a person. The mechanical turk seemed to perform like a human without human intervention, but it required a human in the loop to work properly.
Humans have used non-humans in entertainment for centuries, such as puppets, shadow play, and smoke and mirrors. A show can have animatronic, technological, and non-technological elements, and a live show can blur real and illusion. From medieval puppet shows to mechanical turks to AI filters, bots, and holograms, entertainment has evolved over time.
I'm not a hologram skeptic, but I'm skeptical of technology, especially since I work with it. I love live performances, I love hearing singers breathe, forget lines, and make jokes. Live shows are my favorite because I love watching performers make mistakes or interact with the audience. ABBA Voyage was different.
Marti and I traveled to Manchester after ABBA Voyage to see Liam Gallagher. Similar but different vibe. Similar in that thousands dressed up for the show. ABBA's energy was dizzying. 90s chic replaced sequins in the crowd. Doc Martens, nylon jackets, bucket hats, shaggy hair. The Charlatans and Liam Gallagher opened and closed, respectively. Fireworks. Incredible. People went crazy. Yelling exhausted my voice.
This week in music featured AI-enabled holograms and a decades-old rocker. Both are warm and gooey in our memories.
After seeing both, I'm wondering if we need AI hologram shows. Why? Is it good?
Like everything tech-related, my answer is "maybe." Because context and performance matter. Liam Gallagher and ABBA both had great, different shows.
For a hologram to work, it must be impossible and big. It must be big, showy, and improbable to justify a hologram. It must feel...expensive, like a stadium pop show. According to a quick search, ABBA broke up on bad terms. Reuniting is unlikely. This is also why Prince or Tupac hologram shows work. We can only engage with their legacy through covers or...holograms.
I drove around listening to the radio a few weeks ago. "Dreaming of You" by Selena played. Selena's music defined my childhood. I sang along and turned up the volume (or as loud as my husband would allow me while driving on the highway).
I discovered Selena's music six months after her death, so I never saw her perform live. My babysitter Melissa played me her album after I moved to Houston. Melissa took me to see the Selena movie five times when it came out. I quickly wore out my VHS copy. I constantly sang "Bibi Bibi Bom Bom" and "Como la Flor." I love Selena. A Selena hologram? Yes, probably.
Instagram advertised a cellist's Arthur Russell tribute show. Russell is another deceased artist I love. I almost walked down the aisle to "This is How We Walk on the Moon," but our cellist couldn't find it. Instead, I walked to Magnetic Fields' "The Book of Love." I "discovered" Russell after a friend introduced me to his music a few years ago.
I use these as analogies for the Liam Gallagher and ABBA concerts.
You have no idea how much I'd pay to see a hologram of Selena's 1995 Houston Livestock Show and Rodeo concert. Arthur Russell's hologram is unnecessary. Russell's work was intimate and performance-based. We can't separate his life from his legacy; popular audiences overlooked his genius. He died of AIDS broke. Like Selena, he died prematurely. Given his music and history, another performer would be a better choice than a hologram. He's no Selena. Selena could have rivaled Beyonce.
Pop shows' size works for holograms. Along with ABBA holograms, there was an anime movie and a light show that would put Tron to shame. ABBA created a tourable stadium show. The event was lavish, expensive, and well-planned. Pop, unlike rock, isn't gritty. Liam Gallagher hologram? No longer impossible, it wouldn't work. He's touring. I'm not sure if a rockstar alone should be rendered as a hologram; it was the show that made ABBA a hologram.
Holograms, like AI, are part of the future of entertainment, but not all of it. Because only modern interpretations of Arthur Russell's work reveal his legacy. That's his legacy.
Large-scale arena performers may use holograms in the future, but the experience must be impossible. A teacher once said that the only way to convey emotion in opera is through song, and I feel the same way about holograms, AR, VR, and mixed reality. A story's impossibility must make sense, like in opera. Impossibility and bombastic performance must be present for an immersive element to "work." ABBA was an impossible and improbable experience, which made it magical. It helped the holographic show work.
Marti told me about ABBA Voyage. She said it was a great concert. Marti has worked in music since the 1990s. She's a music expert; she's seen many shows.
Ai isn't a god or sentient, and the ABBA holograms aren't real. The renderings were glassy-eyed, flat, and robotic, like the Polar Express or the Jaws shark. Even today, the uncanny valley is insurmountable. We know it's not real because it's not about reality. It was about a suspended moment and performance feelings.
I knew this was impossible, an 'unreal' experience, but the emotions I felt were real, like watching a movie or tv show. Perhaps this is one of the better uses of AI, like CGI and special effects, like the beauty of entertainment- we were enraptured and entertained for hours. I've been playing ABBA since then.

Karthik Rajan
3 years ago
11 Cooking Hacks I Wish I Knew Earlier
Quick, easy and tasty (and dollops of parenting around food).

My wife and mom are both great mothers. They're super-efficient planners. They soak and ferment food. My 104-year-old grandfather loved fermented foods.
When I'm hungry and need something fast, I waffle to the pantry. Like most people, I like to improvise. I wish I knew these 11 hacks sooner.
1. The world's best pasta sauce only has 3 ingredients.
You watch recipe videos with prepped ingredients. In reality, prepping and washing take time. The food's taste isn't guaranteed. The raw truth at a sublime level is not talked about often.
Sometimes a radical recipe comes along that's so easy and tasty, you're dumbfounded. The Classic Italian Cook Book has a pasta recipe.
One 28-ounce can of whole, peeled tomatoes, one medium peeled onion, and 5 tablespoons of butter. And salt to taste.
Combine everything in a single pot and simmer for 45 minutes, uncovered. Stir occasionally. Toss the onion halves after 45 minutes and pour the sauce over pasta. Finish!
This simple recipe fights our deepest fears.
Salt to taste! Customized to perfection, no frills.
2. Reheating rice with ice. Magical.
Most of the world eats rice. I was raised in south India. My grandfather farmed rice in the Cauvery river delta.
The problem with rice With growing kids, you can't cook just enough. Leftovers are a norm. Microwaves help most people. Ice cubes are the frosting.
Before reheating rice in the microwave, add an ice cube. The ice will steam the rice, making it fluffy and delicious again.
3. Pineapple leaf
if it comes off easy, it is ripe enough to cut. No rethinking.
My daughter loves pineapples like her dad. One daddy task is cutting them. Sharing immediate results is therapeutic.
Timing the cut has been the most annoying part over the years. The pineapple leaf tip reveals the fruitiness inside. Always loved it.
4. Magic knife words (rolling and curling)
Cutting hand: Roll the blade's back, not its tip, to cut.
Other hand: If you can’t see your finger tips, you can’t cut them. So curl your fingers.
I dislike that schools don't teach financial literacy or cutting skills.
My wife and I used scissors differently for 25 years. We both used the thumb. My index finger, her middle. We googled the difference when I noticed it and laughed. She's right.
This video teaches knifing skills:
5. Best advice about heat
If it's done in the pan, it's overdone on the plate.
This simple advice stands out when we worry about ingredients and proportions.
6. The truth about pasta water
Pasta water should be sea-salty.
Properly seasoning food separates good from great. Salt depends is a good line.
Want delicious pasta? Well, then kind of a lot, to be perfectly honest.
7. Clean as you go
Clean blender as you go by blending water and dish soap.
I find clean as you go easier than clean afterwords. This easy tip is gold.
8. Clean as you go (bis)
Microwave a bowl of water, vinegar, and a toothpick for 5 minutes.
2 cups water, 2 tablespoons vinegar, and a toothpick to prevent overflow.
5-minute microwave. Let the steam work for another 2 minutes. Sponge-off dirt and food. Simple.
9 and 10. Tools,tools, tools
Immersion blender and pressure cooker save time and money.
Narrative: I experienced fatherly pride. My middle-schooler loves science. We discussed boiling. I spoke. Water doesn't need 100°C to boil. She looked confused. 100 degrees assume something. The world around the water is a normal room. Changing water pressure affects its boiling point. This saves energy. Pressure cooker magic.
I captivated her. She's into science and sustainable living.
Whistling is a subliminal form of self-expression when done right. Pressure cookers remind me of simple pleasures.
Your handiness depends on your home tools. Immersion blenders are great for pre- and post-cooking. It eliminates chopping and washing. Second to the dishwasher, in my opinion.
11. One pepper is plenty
A story I share with my daughters.
Once, everyone thought about spice (not spicy). More valuable than silk. One of the three mighty oceans was named after a source country. Columbus sailed the wrong way and found America. The explorer called the natives after reaching his spice destination.
It was pre-internet days. His Google wasn't working.
My younger daughter listens in awe. Strong roots. Image cast. She can contextualize one of the ocean names.
I struggle with spices in daily life. Combinations are mind-boggling. I have more spices than Columbus. Flavor explosion has repercussions. You must closely follow the recipe without guarantees. Best aha. Double down on one spice and move on. If you like it, it's great.
I naturally gravitate towards cumin soups, fennel dishes, mint rice, oregano pasta, basil thai curry and cardamom pudding.
Variety enhances life. Each of my dishes is unique.
To each their own comfort food and nostalgic memories.
Happy living!

Sneaker News
3 years ago
This Month Will See The Release Of Travis Scott x Nike Footwear
Following the catastrophes at Astroworld, Travis Scott was swiftly vilified by both media outlets and fans alike, and the names who had previously supported him were quickly abandoned. Nike, on the other hand, remained silent, only delaying the release of La Flame's planned collaborations, such as the Air Max 1 and Air Trainer 1, indefinitely. While some may believe it is too soon for the artist to return to the spotlight, the Swoosh has other ideas, as Nice Kicks reveals that these exact sneakers will be released in May.
Both the Travis Scott x Nike Air Max 1 and the Travis Scott x Nike Air Trainer 1 are set to come in two colorways this month. Tinker Hatfield's renowned runner will meet La Flame's "Baroque Brown" and "Saturn Gold" make-ups, which have been altered with backwards Swooshes and outdoors-themed webbing. The high-top trainer is being customized with Hatfield's "Wheat" and "Grey Haze" palettes, both of which include zippers across the heel, co-branded patches, and other details.
See below for a closer look at the four footwear. TravisScott.com is expected to release the shoes on May 20th, according to Nice Kicks. Following that, on May 27th, Nike SNKRS will release the shoe.
Travis Scott x Nike Air Max 1 "Baroque Brown"
Release Date: 2022
Color: Baroque Brown/Lemon Drop/Wheat/Chile Red
Mens: $160
Style Code: DO9392-200
Pre-School: $85
Style Code: DN4169-200
Infant & Toddler: $70
Style Code: DN4170-200
Travis Scott x Nike Air Max 1 "Saturn Gold"
Release Date: 2022
Color: N/A
Mens: $160
Style Code: DO9392-700
Travis Scott x Nike Air Trainer 1 "Wheat"
Restock Date: May 27th, 2022 (Friday)
Original Release Date: May 20th, 2022 (Friday)
Color: N/A
Mens: $140
Style Code: DR7515-200
Travis Scott x Nike Air Trainer 1 "Grey Haze"
Restock Date: May 27th, 2022 (Friday)
Original Release Date: May 20th, 2022 (Friday)
Color: N/A
Mens: $140
Style Code: DR7515-001