


Day Trading Introduction
Historically, only large financial institutions, brokerages, and trading houses could actively trade in the stock market. With instant global news dissemination and low commissions, developments such as discount brokerages and online trading have leveled the playing—or should we say trading—field. It's never been easier for retail investors to trade like pros thanks to trading platforms like Robinhood and zero commissions.
Day trading is a lucrative career (as long as you do it properly). But it can be difficult for newbies, especially if they aren't fully prepared with a strategy. Even the most experienced day traders can lose money.
So, how does day trading work?
Day Trading Basics
Day trading is the practice of buying and selling a security on the same trading day. It occurs in all markets, but is most common in forex and stock markets. Day traders are typically well educated and well funded. For small price movements in highly liquid stocks or currencies, they use leverage and short-term trading strategies.
Day traders are tuned into short-term market events. News trading is a popular strategy. Scheduled announcements like economic data, corporate earnings, or interest rates are influenced by market psychology. Markets react when expectations are not met or exceeded, usually with large moves, which can help day traders.
Intraday trading strategies abound. Among these are:
- Scalping: This strategy seeks to profit from minor price changes throughout the day.
- Range trading: To determine buy and sell levels, range traders use support and resistance levels.
- News-based trading exploits the increased volatility around news events.
- High-frequency trading (HFT): The use of sophisticated algorithms to exploit small or short-term market inefficiencies.
A Disputed Practice
Day trading's profit potential is often debated on Wall Street. Scammers have enticed novices by promising huge returns in a short time. Sadly, the notion that trading is a get-rich-quick scheme persists. Some daytrade without knowledge. But some day traders succeed despite—or perhaps because of—the risks.
Day trading is frowned upon by many professional money managers. They claim that the reward rarely outweighs the risk. Those who day trade, however, claim there are profits to be made. Profitable day trading is possible, but it is risky and requires considerable skill. Moreover, economists and financial professionals agree that active trading strategies tend to underperform passive index strategies over time, especially when fees and taxes are factored in.
Day trading is not for everyone and is risky. It also requires a thorough understanding of how markets work and various short-term profit strategies. Though day traders' success stories often get a lot of media attention, keep in mind that most day traders are not wealthy: Many will fail, while others will barely survive. Also, while skill is important, bad luck can sink even the most experienced day trader.
Characteristics of a Day Trader
Experts in the field are typically well-established professional day traders.
They usually have extensive market knowledge. Here are some prerequisites for successful day trading.
Market knowledge and experience
Those who try to day-trade without understanding market fundamentals frequently lose. Day traders should be able to perform technical analysis and read charts. Charts can be misleading if not fully understood. Do your homework and know the ins and outs of the products you trade.
Enough capital
Day traders only use risk capital they can lose. This not only saves them money but also helps them trade without emotion. To profit from intraday price movements, a lot of capital is often required. Most day traders use high levels of leverage in margin accounts, and volatile market swings can trigger large margin calls on short notice.
Strategy
A trader needs a competitive advantage. Swing trading, arbitrage, and trading news are all common day trading strategies. They tweak these strategies until they consistently profit and limit losses.
Strategy Breakdown:
Type | Risk | Reward
Swing Trading | High | High
Arbitrage | Low | Medium
Trading News | Medium | Medium
Mergers/Acquisitions | Medium | High
Discipline
A profitable strategy is useless without discipline. Many day traders lose money because they don't meet their own criteria. “Plan the trade and trade the plan,” they say. Success requires discipline.
Day traders profit from market volatility. For a day trader, a stock's daily movement is appealing. This could be due to an earnings report, investor sentiment, or even general economic or company news.
Day traders also prefer highly liquid stocks because they can change positions without affecting the stock's price. Traders may buy a stock if the price rises. If the price falls, a trader may decide to sell short to profit.
A day trader wants to trade a stock that moves (a lot).
Day Trading for a Living
Professional day traders can be self-employed or employed by a larger institution.
Most day traders work for large firms like hedge funds and banks' proprietary trading desks. These traders benefit from direct counterparty lines, a trading desk, large capital and leverage, and expensive analytical software (among other advantages). By taking advantage of arbitrage and news events, these traders can profit from less risky day trades before individual traders react.
Individual traders often manage other people’s money or simply trade with their own. They rarely have access to a trading desk, but they frequently have strong ties to a brokerage (due to high commissions) and other resources. However, their limited scope prevents them from directly competing with institutional day traders. Not to mention more risks. Individuals typically day trade highly liquid stocks using technical analysis and swing trades, with some leverage.
Day trading necessitates access to some of the most complex financial products and services. Day traders usually need:
Access to a trading desk
Traders who work for large institutions or manage large sums of money usually use this. The trading or dealing desk provides these traders with immediate order execution, which is critical during volatile market conditions. For example, when an acquisition is announced, day traders interested in merger arbitrage can place orders before the rest of the market.
News sources
The majority of day trading opportunities come from news, so being the first to know when something significant happens is critical. It has access to multiple leading newswires, constant news coverage, and software that continuously analyzes news sources for important stories.
Analytical tools
Most day traders rely on expensive trading software. Technical traders and swing traders rely on software more than news. This software's features include:
-
Automatic pattern recognition: It can identify technical indicators like flags and channels, or more complex indicators like Elliott Wave patterns.
-
Genetic and neural applications: These programs use neural networks and genetic algorithms to improve trading systems and make more accurate price predictions.
-
Broker integration: Some of these apps even connect directly to the brokerage, allowing for instant and even automatic trade execution. This reduces trading emotion and improves execution times.
-
Backtesting: This allows traders to look at past performance of a strategy to predict future performance. Remember that past results do not always predict future results.
Together, these tools give traders a competitive advantage. It's easy to see why inexperienced traders lose money without them. A day trader's earnings potential is also affected by the market in which they trade, their capital, and their time commitment.
Day Trading Risks
Day trading can be intimidating for the average investor due to the numerous risks involved. The SEC highlights the following risks of day trading:
Because day traders typically lose money in their first months of trading and many never make profits, they should only risk money they can afford to lose.
Trading is a full-time job that is stressful and costly: Observing dozens of ticker quotes and price fluctuations to spot market trends requires intense concentration. Day traders also spend a lot on commissions, training, and computers.
Day traders heavily rely on borrowing: Day-trading strategies rely on borrowed funds to make profits, which is why many day traders lose everything and end up in debt.
Avoid easy profit promises: Avoid “hot tips” and “expert advice” from day trading newsletters and websites, and be wary of day trading educational seminars and classes.
Should You Day Trade?
As stated previously, day trading as a career can be difficult and demanding.
- First, you must be familiar with the trading world and know your risk tolerance, capital, and goals.
- Day trading also takes a lot of time. You'll need to put in a lot of time if you want to perfect your strategies and make money. Part-time or whenever isn't going to cut it. You must be fully committed.
- If you decide trading is for you, remember to start small. Concentrate on a few stocks rather than jumping into the market blindly. Enlarging your trading strategy can result in big losses.
- Finally, keep your cool and avoid trading emotionally. The more you can do that, the better. Keeping a level head allows you to stay focused and on track.
If you follow these simple rules, you may be on your way to a successful day trading career.
Is Day Trading Illegal?
Day trading is not illegal or unethical, but it is risky. Because most day-trading strategies use margin accounts, day traders risk losing more than they invest and becoming heavily in debt.
How Can Arbitrage Be Used in Day Trading?
Arbitrage is the simultaneous purchase and sale of a security in multiple markets to profit from small price differences. Because arbitrage ensures that any deviation in an asset's price from its fair value is quickly corrected, arbitrage opportunities are rare.
Why Don’t Day Traders Hold Positions Overnight?
Day traders rarely hold overnight positions for several reasons: Overnight trades require more capital because most brokers require higher margin; stocks can gap up or down on overnight news, causing big trading losses; and holding a losing position overnight in the hope of recovering some or all of the losses may be against the trader's core day-trading philosophy.
What Are Day Trader Margin Requirements?
Regulation D requires that a pattern day trader client of a broker-dealer maintain at all times $25,000 in equity in their account.
How Much Buying Power Does Day Trading Have?
Buying power is the total amount of funds an investor has available to trade securities. FINRA rules allow a pattern day trader to trade up to four times their maintenance margin excess as of the previous day's close.
The Verdict
Although controversial, day trading can be a profitable strategy. Day traders, both institutional and retail, keep the markets efficient and liquid. Though day trading is still popular among novice traders, it should be left to those with the necessary skills and resources.
More on Economics & Investing

Theresa W. Carey
3 years ago
How Payment for Order Flow (PFOF) Works
What is PFOF?
PFOF is a brokerage firm's compensation for directing orders to different parties for trade execution. The brokerage firm receives fractions of a penny per share for directing the order to a market maker.
Each optionable stock could have thousands of contracts, so market makers dominate options trades. Order flow payments average less than $0.50 per option contract.
Order Flow Payments (PFOF) Explained
The proliferation of exchanges and electronic communication networks has complicated equity and options trading (ECNs) Ironically, Bernard Madoff, the Ponzi schemer, pioneered pay-for-order-flow.
In a December 2000 study on PFOF, the SEC said, "Payment for order flow is a method of transferring trading profits from market making to brokers who route customer orders to specialists for execution."
Given the complexity of trading thousands of stocks on multiple exchanges, market making has grown. Market makers are large firms that specialize in a set of stocks and options, maintaining an inventory of shares and contracts for buyers and sellers. Market makers are paid the bid-ask spread. Spreads have narrowed since 2001, when exchanges switched to decimals. A market maker's ability to play both sides of trades is key to profitability.
Benefits, requirements
A broker receives fees from a third party for order flow, sometimes without a client's knowledge. This invites conflicts of interest and criticism. Regulation NMS from 2005 requires brokers to disclose their policies and financial relationships with market makers.
Your broker must tell you if it's paid to send your orders to specific parties. This must be done at account opening and annually. The firm must disclose whether it participates in payment-for-order-flow and, upon request, every paid order. Brokerage clients can request payment data on specific transactions, but the response takes weeks.
Order flow payments save money. Smaller brokerage firms can benefit from routing orders through market makers and getting paid. This allows brokerage firms to send their orders to another firm to be executed with other orders, reducing costs. The market maker or exchange benefits from additional share volume, so it pays brokerage firms to direct traffic.
Retail investors, who lack bargaining power, may benefit from order-filling competition. Arrangements to steer the business in one direction invite wrongdoing, which can erode investor confidence in financial markets and their players.
Pay-for-order-flow criticism
It has always been controversial. Several firms offering zero-commission trades in the late 1990s routed orders to untrustworthy market makers. During the end of fractional pricing, the smallest stock spread was $0.125. Options spreads widened. Traders found that some of their "free" trades cost them a lot because they weren't getting the best price.
The SEC then studied the issue, focusing on options trades, and nearly decided to ban PFOF. The proliferation of options exchanges narrowed spreads because there was more competition for executing orders. Options market makers said their services provided liquidity. In its conclusion, the report said, "While increased multiple-listing produced immediate economic benefits to investors in the form of narrower quotes and effective spreads, these improvements have been muted with the spread of payment for order flow and internalization."
The SEC allowed payment for order flow to continue to prevent exchanges from gaining monopoly power. What would happen to trades if the practice was outlawed was also unclear. SEC requires brokers to disclose financial arrangements with market makers. Since then, the SEC has watched closely.
2020 Order Flow Payment
Rule 605 and Rule 606 show execution quality and order flow payment statistics on a broker's website. Despite being required by the SEC, these reports can be hard to find. The SEC mandated these reports in 2005, but the format and reporting requirements have changed over the years, most recently in 2018.
Brokers and market makers formed a working group with the Financial Information Forum (FIF) to standardize order execution quality reporting. Only one retail brokerage (Fidelity) and one market maker remain (Two Sigma Securities). FIF notes that the 605/606 reports "do not provide the level of information that allows a retail investor to gauge how well a broker-dealer fills a retail order compared to the NBBO (national best bid or offer’) at the time the order was received by the executing broker-dealer."
In the first quarter of 2020, Rule 606 reporting changed to require brokers to report net payments from market makers for S&P 500 and non-S&P 500 equity trades and options trades. Brokers must disclose payment rates per 100 shares by order type (market orders, marketable limit orders, non-marketable limit orders, and other orders).
Richard Repetto, Managing Director of New York-based Piper Sandler & Co., publishes a report on Rule 606 broker reports. Repetto focused on Charles Schwab, TD Ameritrade, E-TRADE, and Robinhood in Q2 2020. Repetto reported that payment for order flow was higher in the second quarter than the first due to increased trading activity, and that options paid more than equities.
Repetto says PFOF contributions rose overall. Schwab has the lowest options rates, while TD Ameritrade and Robinhood have the highest. Robinhood had the highest equity rating. Repetto assumes Robinhood's ability to charge higher PFOF reflects their order flow profitability and that they receive a fixed rate per spread (vs. a fixed rate per share by the other brokers).
Robinhood's PFOF in equities and options grew the most quarter-over-quarter of the four brokers Piper Sandler analyzed, as did their implied volumes. All four brokers saw higher PFOF rates.
TD Ameritrade took the biggest income hit when cutting trading commissions in fall 2019, and this report shows they're trying to make up the shortfall by routing orders for additional PFOF. Robinhood refuses to disclose trading statistics using the same metrics as the rest of the industry, offering only a vague explanation on their website.
Summary
Payment for order flow has become a major source of revenue as brokers offer no-commission equity (stock and ETF) orders. For retail investors, payment for order flow poses a problem because the brokerage may route orders to a market maker for its own benefit, not the investor's.
Infrequent or small-volume traders may not notice their broker's PFOF practices. Frequent traders and those who trade larger quantities should learn about their broker's order routing system to ensure they're not losing out on price improvement due to a broker prioritizing payment for order flow.
This post is a summary. Read full article here

Sam Hickmann
3 years ago
Donor-Advised Fund Tax Benefits (DAF)
Giving through a donor-advised fund can be tax-efficient. Using a donor-advised fund can reduce your tax liability while increasing your charitable impact.
Grow Your Donations Tax-Free.
Your DAF's charitable dollars can be invested before being distributed. Your DAF balance can grow with the market. This increases grantmaking funds. The assets of the DAF belong to the charitable sponsor, so you will not be taxed on any growth.
Avoid a Windfall Tax Year.
DAFs can help reduce tax burdens after a windfall like an inheritance, business sale, or strong market returns. Contributions to your DAF are immediately tax deductible, lowering your taxable income. With DAFs, you can effectively pre-fund years of giving with assets from a single high-income event.
Make a contribution to reduce or eliminate capital gains.
One of the most common ways to fund a DAF is by gifting publicly traded securities. Securities held for more than a year can be donated at fair market value and are not subject to capital gains tax. If a donor liquidates assets and then donates the proceeds to their DAF, capital gains tax reduces the amount available for philanthropy. Gifts of appreciated securities, mutual funds, real estate, and other assets are immediately tax deductible up to 30% of Adjusted gross income (AGI), with a five-year carry-forward for gifts that exceed AGI limits.
Using Appreciated Stock as a Gift
Donating appreciated stock directly to a DAF rather than liquidating it and donating the proceeds reduces philanthropists' tax liability by eliminating capital gains tax and lowering marginal income tax.
In the example below, a donor has $100,000 in long-term appreciated stock with a cost basis of $10,000:
Using a DAF would allow this donor to give more to charity while paying less taxes. This strategy often allows donors to give more than 20% more to their favorite causes.
For illustration purposes, this hypothetical example assumes a 35% income tax rate. All realized gains are subject to the federal long-term capital gains tax of 20% and the 3.8% Medicare surtax. No other state taxes are considered.
The information provided here is general and educational in nature. It is not intended to be, nor should it be construed as, legal or tax advice. NPT does not provide legal or tax advice. Furthermore, the content provided here is related to taxation at the federal level only. NPT strongly encourages you to consult with your tax advisor or attorney before making charitable contributions.

Jan-Patrick Barnert
3 years ago
Wall Street's Bear Market May Stick Around
If history is any guide, this bear market might be long and severe.
This is the S&P 500 Index's fourth such incident in 20 years. The last bear market of 2020 was a "shock trade" caused by the Covid-19 pandemic, although earlier ones in 2000 and 2008 took longer to bottom out and recover.
Peter Garnry, head of equities strategy at Saxo Bank A/S, compares the current selloff to the dotcom bust of 2000 and the 1973-1974 bear market marked by soaring oil prices connected to an OPEC oil embargo. He blamed high tech valuations and the commodity crises.
"This drop might stretch over a year and reach 35%," Garnry wrote.
Here are six bear market charts.
Time/depth
The S&P 500 Index plummeted 51% between 2000 and 2002 and 58% during the global financial crisis; it took more than 1,000 trading days to recover. The former took 638 days to reach a bottom, while the latter took 352 days, suggesting the present selloff is young.
Valuations
Before the tech bubble burst in 2000, valuations were high. The S&P 500's forward P/E was 25 times then. Before the market fell this year, ahead values were near 24. Before the global financial crisis, stocks were relatively inexpensive, but valuations dropped more than 40%, compared to less than 30% now.
Earnings
Every stock crash, especially earlier bear markets, returned stocks to fundamentals. The S&P 500 decouples from earnings trends but eventually recouples.
Support
Central banks won't support equity investors just now. The end of massive monetary easing will terminate a two-year bull run that was among the strongest ever, and equities may struggle without cheap money. After years of "don't fight the Fed," investors must embrace a new strategy.
Bear Haunting Bear
If the past is any indication, rising government bond yields are bad news. After the financial crisis, skyrocketing rates and a falling euro pushed European stock markets back into bear territory in 2011.
Inflation/rates
The current monetary policy climate differs from past bear markets. This is the first time in a while that markets face significant inflation and rising rates.
This post is a summary. Read full article here
You might also like

Ashraful Islam
4 years ago
Clean API Call With React Hooks
| Photo by Juanjo Jaramillo on Unsplash |
Calling APIs is the most common thing to do in any modern web application. When it comes to talking with an API then most of the time we need to do a lot of repetitive things like getting data from an API call, handling the success or error case, and so on.
When calling tens of hundreds of API calls we always have to do those tedious tasks. We can handle those things efficiently by putting a higher level of abstraction over those barebone API calls, whereas in some small applications, sometimes we don’t even care.
The problem comes when we start adding new features on top of the existing features without handling the API calls in an efficient and reusable manner. In that case for all of those API calls related repetitions, we end up with a lot of repetitive code across the whole application.
In React, we have different approaches for calling an API. Nowadays mostly we use React hooks. With React hooks, it’s possible to handle API calls in a very clean and consistent way throughout the application in spite of whatever the application size is. So let’s see how we can make a clean and reusable API calling layer using React hooks for a simple web application.
I’m using a code sandbox for this blog which you can get here.
import "./styles.css";
import React, { useEffect, useState } from "react";
import axios from "axios";
export default function App() {
const [posts, setPosts] = useState(null);
const [error, setError] = useState("");
const [loading, setLoading] = useState(false);
useEffect(() => {
handlePosts();
}, []);
const handlePosts = async () => {
setLoading(true);
try {
const result = await axios.get(
"https://jsonplaceholder.typicode.com/posts"
);
setPosts(result.data);
} catch (err) {
setError(err.message || "Unexpected Error!");
} finally {
setLoading(false);
}
};
return (
<div className="App">
<div>
<h1>Posts</h1>
{loading && <p>Posts are loading!</p>}
{error && <p>{error}</p>}
<ul>
{posts?.map((post) => (
<li key={post.id}>{post.title}</li>
))}
</ul>
</div>
</div>
);
}
I know the example above isn’t the best code but at least it’s working and it’s valid code. I will try to improve that later. For now, we can just focus on the bare minimum things for calling an API.
Here, you can try to get posts data from JsonPlaceholer. Those are the most common steps we follow for calling an API like requesting data, handling loading, success, and error cases.
If we try to call another API from the same component then how that would gonna look? Let’s see.
500: Internal Server Error
Now it’s going insane! For calling two simple APIs we’ve done a lot of duplication. On a top-level view, the component is doing nothing but just making two GET requests and handling the success and error cases. For each request, it’s maintaining three states which will periodically increase later if we’ve more calls.
Let’s refactor to make the code more reusable with fewer repetitions.
Step 1: Create a Hook for the Redundant API Request Codes
Most of the repetitions we have done so far are about requesting data, handing the async things, handling errors, success, and loading states. How about encapsulating those things inside a hook?
The only unique things we are doing inside handleComments and handlePosts are calling different endpoints. The rest of the things are pretty much the same. So we can create a hook that will handle the redundant works for us and from outside we’ll let it know which API to call.
500: Internal Server Error
Here, this request function is identical to what we were doing on the handlePosts and handleComments. The only difference is, it’s calling an async function apiFunc which we will provide as a parameter with this hook. This apiFunc is the only independent thing among any of the API calls we need.
With hooks in action, let’s change our old codes in App component, like this:
500: Internal Server Error
How about the current code? Isn’t it beautiful without any repetitions and duplicate API call handling things?
Let’s continue our journey from the current code. We can make App component more elegant. Now it knows a lot of details about the underlying library for the API call. It shouldn’t know that. So, here’s the next step…
Step 2: One Component Should Take Just One Responsibility
Our App component knows too much about the API calling mechanism. Its responsibility should just request the data. How the data will be requested under the hood, it shouldn’t care about that.
We will extract the API client-related codes from the App component. Also, we will group all the API request-related codes based on the API resource. Now, this is our API client:
import axios from "axios";

const apiClient = axios.create({
  // Later read this URL from an environment variable
  baseURL: "https://jsonplaceholder.typicode.com"
});

export default apiClient;
All API calls for comments resource will be in the following file:
import client from "./client";

const getComments = () => client.get("/comments");

export default {
  getComments
};
All API calls for posts resource are placed in the following file:
import client from "./client";

const getPosts = () => client.get("/posts");

export default {
  getPosts
};
Finally, the App component looks like the following:
import "./styles.css";
import React, { useEffect } from "react";
import commentsApi from "./api/comments";
import postsApi from "./api/posts";
import useApi from "./hooks/useApi";

export default function App() {
  const getPostsApi = useApi(postsApi.getPosts);
  const getCommentsApi = useApi(commentsApi.getComments);

  useEffect(() => {
    getPostsApi.request();
    getCommentsApi.request();
  }, []);

  return (
    <div className="App">
      {/* Post List */}
      <div>
        <h1>Posts</h1>
        {getPostsApi.loading && <p>Posts are loading!</p>}
        {getPostsApi.error && <p>{getPostsApi.error}</p>}
        <ul>
          {getPostsApi.data?.map((post) => (
            <li key={post.id}>{post.title}</li>
          ))}
        </ul>
      </div>
      {/* Comment List */}
      <div>
        <h1>Comments</h1>
        {getCommentsApi.loading && <p>Comments are loading!</p>}
        {getCommentsApi.error && <p>{getCommentsApi.error}</p>}
        <ul>
          {getCommentsApi.data?.map((comment) => (
            <li key={comment.id}>{comment.name}</li>
          ))}
        </ul>
      </div>
    </div>
  );
}
Now it doesn’t know anything about how the APIs get called. Tomorrow if we want to change the API calling library from axios to fetch or anything else, our App component code will not get affected. We can just change the codes form client.js This is the beauty of abstraction.
Apart from the abstraction of API calls, Appcomponent isn’t right the place to show the list of the posts and comments. It’s a high-level component. It shouldn’t handle such low-level data interpolation things.
So we should move this data display-related things to another low-level component. Here I placed those directly in the App component just for the demonstration purpose and not to distract with component composition-related things.
Final Thoughts
The React library gives the flexibility for using any kind of third-party library based on the application’s needs. As it doesn’t have any predefined architecture so different teams/developers adopted different approaches to developing applications with React. There’s nothing good or bad. We choose the development practice based on our needs/choices. One thing that is there beyond any choices is writing clean and maintainable codes.

Jenn Leach
3 years ago
I created a faceless TikTok account. Six months later.
Follower count, earnings, and more
I created my 7th TikTok account six months ago. TikTok's great. I've developed accounts for Amazon products, content creators/brand deals education, website flipping, and more.
Introverted or shy people use faceless TikTok accounts.
Maybe they don't want millions of people to see their face online, or they want to remain anonymous so relatives and friends can't locate them.
Going faceless on TikTok can help you grow a following, communicate your message, and make money online.
Here are 6 steps I took to turn my Tik Tok account into a $60,000/year side gig.
From nothing to $60K in 6 months
It's clickbait, but it’s true. Here’s what I did to get here.
Quick context:
I've used social media before. I've spent years as a social creator and brand.
I've built Instagram, TikTok, and YouTube accounts to nearly 100K.
How I did it
First, select a niche.
If you can focus on one genre on TikTok, you'll have a better chance of success, however lifestyle creators do well too.
Niching down is easier, in my opinion.
Examples:
Travel
Food
Kids
Earning cash
Finance
You can narrow these niches if you like.
During the pandemic, a travel blogger focused on Texas-only tourism and gained 1 million subscribers.
Couponing might be a finance specialization.
One of my finance TikTok accounts gives credit tips and grants and has 23K followers.
Tons of ways you can get more specific.
Consider how you'll monetize your TikTok account. I saw many enormous TikTok accounts that lose money.
Why?
They can't monetize their niche. Not impossible to commercialize, but tough enough to inhibit action.
First, determine your goal.
In this first step, consider what your end goal is.
Are you trying to promote your digital products or social media management services?
You want brand deals or e-commerce sales.
This will affect your TikTok specialty.
This is the first step to a TikTok side gig.
Step 2: Pick a content style
Next, you want to decide on your content style.
Do you do voiceover and screenshots?
You'll demonstrate a product?
Will you faceless vlog?
Step 3: Look at the competition
Find anonymous accounts and analyze what content works, where they thrive, what their audience wants, etc.
This can help you make better content.
Like the skyscraper method for TikTok.
Step 4: Create a content strategy.
Your content plan is where you sit down and decide:
How many videos will you produce each day or each week?
Which links will you highlight in your biography?
What amount of time can you commit to this project?
You may schedule when to post videos on a calendar. Make videos.
5. Create videos.
No video gear needed.
Using a phone is OK, and I think it's preferable than posting drafts from a computer or phone.
TikTok prefers genuine material.
Use their app, tools, filters, and music to make videos.
And imperfection is preferable. Tik okers like to see videos made in a bedroom, not a film studio.
Make sense?
When making videos, remember this.
I personally use my phone and tablet.
Step 6: Monetize
Lastly, it’s time to monetize How will you make money? You decided this in step 1.
Time to act!
For brand agreements
Include your email in the bio.
Share several sites and use a beacons link in your bio.
Make cold calls to your favorite companies to get them to join you in a TikTok campaign.
For e-commerce
Include a link to your store's or a product's page in your bio.
For client work
Include your email in the bio.
Use a beacons link to showcase your personal website, portfolio, and other resources.
For affiliate marketing
Include affiliate product links in your bio.
Join the Amazon Influencer program and provide a link to your storefront in your bio.
$60,000 per year from Tik Tok?
Yes, and some creators make much more.
Tori Dunlap (herfirst100K) makes $100,000/month on TikTok.
My TikTok adventure took 6 months, but by month 2 I was making $1,000/month (or $12K/year).
By year's end, I want this account to earn $100K/year.
Imagine if my 7 TikTok accounts made $100K/year.
7 Tik Tok accounts X $100K/yr = $700,000/year

Isaiah McCall
3 years ago
There is a new global currency emerging, but it is not bitcoin.
America should avoid BRICS

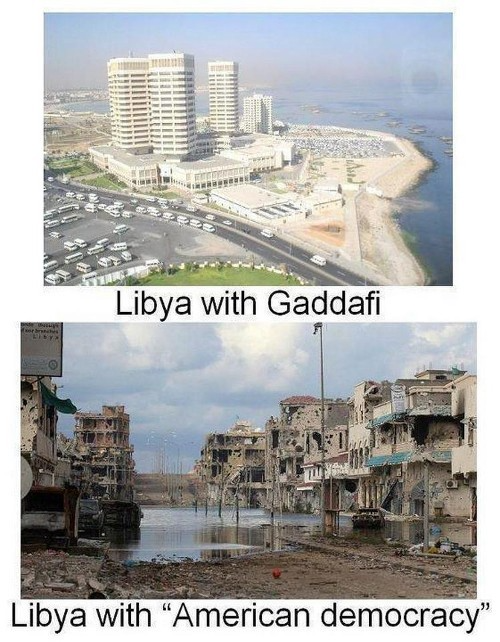
Vladimir Putin has watched videos of Muammar Gaddafi's CIA-backed demise.
Gaddafi...
Thief.
Did you know Gaddafi wanted a gold-backed dinar for Africa? Because he considered our global financial system was a Ponzi scheme, he wanted to discontinue trading oil in US dollars.
Or, Gaddafi's Libya enjoyed Africa's highest quality of living before becoming freed. Pictured:
Vladimir Putin is a nasty guy, but he had his reasons for not mentioning NATO assisting Ukraine in resisting US imperialism. Nobody tells you. Sure.
The US dollar's corruption post-2008, debasement by quantitative easing, and lack of value are key factors. BRICS will replace the dollar.
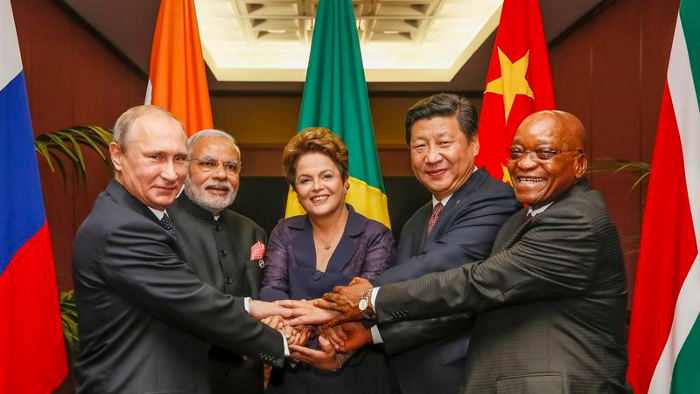
BRICS aren't bricks.
Economy-related.
Brazil, Russia, India, China, and South Africa have cooperated for 14 years to fight U.S. hegemony with a new international currency: BRICS.
BRICS is mostly comical. Now. Saudi Arabia, the second-largest oil hegemon, wants to join.
So what?
The New World Currency is BRICS
Russia was kicked out of G8 for its aggressiveness in Crimea in 2014.
It's now G7.
No biggie, said Putin, he said, and I quote, “Bon appetite.”
He was prepared. China, India, and Brazil lead the New World Order.
Together, they constitute 40% of the world's population and, according to the IMF, 50% of the world's GDP by 2030.
Here’s what the BRICS president Marcos Prado Troyjo had to say earlier this year about no longer needing the US dollar: “We have implemented the mechanism of mutual settlements in rubles and rupees, and there is no need for our countries to use the dollar in mutual settlements. And today a similar mechanism of mutual settlements in rubles and yuan is being developed by China.”
Ick. That's D.C. and NYC warmongers licking their chops for WW3 nasty.
Here's a lovely picture of BRICS to relax you:
If Saudi Arabia joins BRICS, as President Mohammed Bin Salman has expressed interest, a majority of the Middle East will have joined forces to construct a new world order not based on the US currency.
I'm not sure of the new acronym.
SBRICSS? CIRBSS? CRIBSS?
The Reason America Is Harvesting What It Sowed
BRICS began 14 years ago.
14 years ago, what occurred? Concentrate. It involved CDOs, bad subprime mortgages, and Wall Street quants crunching numbers.
2008 recession
When two nations trade, they do so in US dollars, not Euros or gold.
What happened when 2008, an avoidable crisis caused by US banks' cupidity and ignorance, what happened?
Everyone WORLDWIDE felt the pain.
Mostly due to corporate America's avarice.
This should have been a warning that China and Russia had enough of our bs. Like when France sent a battleship to America after Nixon scrapped the gold standard. The US was warned to shape up or be dethroned (or at least try).
Nixon improved in 1971. Kinda. Invented PetroDollar.
Another BS system that unfairly favors America and possibly pushed Russia, China, and Saudi Arabia into BRICS.
The PetroDollar forces oil-exporting nations to trade in US dollars and invest in US Treasury bonds. Brilliant. Genius evil.
Our misdeeds are:
In conflicts that are not its concern, the USA uses the global reserve currency as a weapon.
Targeted nations abandon the dollar, and rightfully so, as do nations that depend on them for trade in vital resources.
The dollar's position as the world's reserve currency is in jeopardy, which could have disastrous economic effects.
Although we have actually sown our own doom, we appear astonished. According to the Bible, whomever sows to appease his sinful nature will reap destruction from that nature whereas whoever sows to appease the Spirit will reap eternal life from the Spirit.
Americans, even our leaders, lack caution and delayed pleasure. When our unsustainable systems fail, we double down. Bailouts of the banks in 2008 were myopic, puerile, and another nail in America's hegemony.
America has screwed everyone.
We're unpopular.
The BRICS's future
It's happened before.
Saddam Hussein sold oil in Euros in 2000, and the US invaded Iraq a month later. The media has devalued the word conspiracy. The Iraq conspiracy.
There were no WMDs, but NYT journalists like Judy Miller drove Americans into a warmongering frenzy because Saddam would ruin the PetroDollar. Does anyone recall that this war spawned ISIS?
I think America has done good for the world. You can make a convincing case that we're many people's villain.
Learn more in Confessions of an Economic Hitman, The Devil's Chessboard, or Tyranny of the Federal Reserve. Or ignore it. That's easier.
We, America, should extend an olive branch, ask for forgiveness, and learn from our faults, as the Tao Te Ching advises. Unlikely. Our population is apathetic and stupid, and our government is corrupt.
Argentina, Iran, Egypt, and Turkey have also indicated interest in joining BRICS. They're also considering making it gold-backed, making it a new world reserve currency.
You should pay attention.
Thanks for reading!