More on Productivity

Leonardo Castorina
3 years ago
How to Use Obsidian to Boost Research Productivity
Tools for managing your PhD projects, reading lists, notes, and inspiration.
As a researcher, you have to know everything. But knowledge is useless if it cannot be accessed quickly. An easy-to-use method of archiving information makes taking notes effortless and enjoyable.
As a PhD student in Artificial Intelligence, I use Obsidian (https://obsidian.md) to manage my knowledge.
The article has three parts:
- What is a note, how to organize notes, tags, folders, and links? This section is tool-agnostic, so you can use most of these ideas with any note-taking app.
- Instructions for using Obsidian, managing notes, reading lists, and useful plugins. This section demonstrates how I use Obsidian, my preferred knowledge management tool.
- Workflows: How to use Zotero to take notes from papers, manage multiple projects' notes, create MOCs with Dataview, and more. This section explains how to use Obsidian to solve common scientific problems and manage/maintain your knowledge effectively.
This list is not perfect or complete, but it is my current solution to problems I've encountered during my PhD. Please leave additional comments or contact me if you have any feedback. I'll try to update this article.
Throughout the article, I'll refer to your digital library as your "Obsidian Vault" or "Zettelkasten".
Other useful resources are listed at the end of the article.
1. Philosophy: Taking and organizing notes
Carl Sagan: “To make an apple pie from scratch, you must first create the universe.”
Before diving into Obsidian, let's establish a Personal Knowledge Management System and a Zettelkasten. You can skip to Section 2 if you already know these terms.
Niklas Luhmann, a prolific sociologist who wrote 400 papers and 70 books, inspired this section and much of Zettelkasten. Zettelkasten means “slip box” (or library in this article). His Zettlekasten had around 90000 physical notes, which can be found here.
There are now many tools available to help with this process. Obsidian's website has a good introduction section: https://publish.obsidian.md/hub/
Notes
We'll start with "What is a note?" Although it may seem trivial, the answer depends on the topic or your note-taking style. The idea is that a note is as “atomic” (i.e. You should read the note and get the idea right away.
The resolution of your notes depends on their detail. Deep Learning, for example, could be a general description of Neural Networks, with a few notes on the various architectures (eg. Recurrent Neural Networks, Convolutional Neural Networks etc..).
Limiting length and detail is a good rule of thumb. If you need more detail in a specific section of this note, break it up into smaller notes. Deep Learning now has three notes:
- Deep Learning
- Recurrent Neural Networks
- Convolutional Neural Networks
Repeat this step as needed until you achieve the desired granularity. You might want to put these notes in a “Neural Networks” folder because they are all about the same thing. But there's a better way:
#Tags and [[Links]] over /Folders/
The main issue with folders is that they are not flexible and assume that all notes in the folder belong to a single category. This makes it difficult to make connections between topics.
Deep Learning has been used to predict protein structure (AlphaFold) and classify images (ImageNet). Imagine a folder structure like this:
- /Proteins/
- Protein Folding
- /Deep Learning/
- /Proteins/
Your notes about Protein Folding and Convolutional Neural Networks will be separate, and you won't be able to find them in the same folder.
This can be solved in several ways. The most common one is to use tags rather than folders. A note can be grouped with multiple topics this way. Obsidian tags can also be nested (have subtags).
You can also link two notes together. You can build your “Knowledge Graph” in Obsidian and other note-taking apps like Obsidian.
My Knowledge Graph. Green: Biology, Red: Machine Learning, Yellow: Autoencoders, Blue: Graphs, Brown: Tags.
My Knowledge Graph and the note “Backrpropagation” and its links.
Backpropagation note and all its links
Why use Folders?
Folders help organize your vault as it grows. The main suggestion is to have few folders that "weakly" collect groups of notes or better yet, notes from different sources.
Among my Zettelkasten folders are:
My Zettelkasten's 5 folders
They usually gather data from various sources:
MOC: Map of Contents for the Zettelkasten.
Projects: Contains one note for each side-project of my PhD where I log my progress and ideas. Notes are linked to these.
Bio and ML: These two are the main content of my Zettelkasten and could theoretically be combined.
Papers: All my scientific paper notes go here. A bibliography links the notes. Zotero .bib file
Books: I make a note for each book I read, which I then split into multiple notes.
Keeping images separate from other files can help keep your main folders clean.
I will elaborate on these in the Workflow Section.
My general recommendation is to use tags and links instead of folders.
Maps of Content (MOC)
Making Tables of Contents is a good solution (MOCs).
These are notes that "signposts" your Zettelkasten library, directing you to the right type of notes. It can link to other notes based on common tags. This is usually done with a title, then your notes related to that title. As an example:
An example of a Machine Learning MOC generated with Dataview.
As shown above, my Machine Learning MOC begins with the basics. Then it's on to Variational Auto-Encoders. Not only does this save time, but it also saves scrolling through the tag search section.
So I keep MOCs at the top of my library so I can quickly find information and see my library. These MOCs are generated automatically using an Obsidian Plugin called Dataview (https://github.com/blacksmithgu/obsidian-dataview).
Ideally, MOCs could be expanded to include more information about the notes, their status, and what's left to do. In the absence of this, Dataview does a fantastic job at creating a good structure for your notes.
In the absence of this, Dataview does a fantastic job at creating a good structure for your notes.
2. Tools: Knowing Obsidian
Obsidian is my preferred tool because it is free, all notes are stored in Markdown format, and each panel can be dragged and dropped. You can get it here: https://obsidian.md/
Obsidian interface.
Obsidian is highly customizable, so here is my preferred interface:
The theme is customized from https://github.com/colineckert/obsidian-things
Alternatively, each panel can be collapsed, moved, or removed as desired. To open a panel later, click on the vertical "..." (bottom left of the note panel).
My interface is organized as follows:
How my Obsidian Interface is organized.
Folders/Search:
This is where I keep all relevant folders. I usually use the MOC note to navigate, but sometimes I use the search button to find a note.
Tags:
I use nested tags and look into each one to find specific notes to link.
cMenu:
Easy-to-use menu plugin cMenu (https://github.com/chetachiezikeuzor/cMenu-Plugin)
Global Graph:
The global graph shows all your notes (linked and unlinked). Linked notes will appear closer together. Zoom in to read each note's title. It's a bit overwhelming at first, but as your library grows, you get used to the positions and start thinking of new connections between notes.
Local Graph:
Your current note will be shown in relation to other linked notes in your library. When needed, you can quickly jump to another link and back to the current note.
Links:
Finally, an outline panel and the plugin Obsidian Power Search (https://github.com/aviral-batra/obsidian-power-search) allow me to search my vault by highlighting text.
Start using the tool and worry about panel positioning later. I encourage you to find the best use-case for your library.
Plugins
An additional benefit of using Obsidian is the large plugin library. I use several (Calendar, Citations, Dataview, Templater, Admonition):
Obsidian Calendar Plugin: https://github.com/liamcain
It organizes your notes on a calendar. This is ideal for meeting notes or keeping a journal.
Calendar addon from hans/obsidian-citation-plugin
Obsidian Citation Plugin: https://github.com/hans/
Allows you to cite papers from a.bib file. You can also customize your notes (eg. Title, Authors, Abstract etc..)
Plugin citation from hans/obsidian-citation-plugin
Obsidian Dataview: https://github.com/blacksmithgu/
A powerful plugin that allows you to query your library as a database and generate content automatically. See the MOC section for an example.
Allows you to create notes with specific templates like dates, tags, and headings.
Templater. Obsidian Admonition: https://github.com/valentine195/obsidian-admonition
Blocks allow you to organize your notes.
Plugin warning. Obsidian Admonition (valentine195)
There are many more, but this list should get you started.
3. Workflows: Cool stuff
Here are a few of my workflows for using obsidian for scientific research. This is a list of resources I've found useful for my use-cases. I'll outline and describe them briefly so you can skim them quickly.
3.1 Using Templates to Structure Notes
3.2 Free Note Syncing (Laptop, Phone, Tablet)
3.3 Zotero/Mendeley/JabRef -> Obsidian — Managing Reading Lists
3.4 Projects and Lab Books
3.5 Private Encrypted Diary
3.1 Using Templates to Structure Notes
Plugins: Templater and Dataview (optional).
To take effective notes, you must first make adding new notes as easy as possible. Templates can save you time and give your notes a consistent structure. As an example:
An example of a note using a template.
### [[YOUR MOC]]
# Note Title of your note
**Tags**::
**Links**::
The top line links to your knowledge base's Map of Content (MOC) (see previous sections). After the title, I add tags (and a link between the note and the tag) and links to related notes.
To quickly identify all notes that need to be expanded, I add the tag “#todo”. In the “TODO:” section, I list the tasks within the note.
The rest are notes on the topic.
Templater can help you create these templates. For new books, I use the following template:
### [[Books MOC]]
# Title
**Author**::
**Date::
**Tags::
**Links::
A book template example.
Using a simple query, I can hook Dataview to it.
dataview
table author as Author, date as “Date Finished”, tags as “Tags”, grade as “Grade”
from “4. Books”
SORT grade DESCENDING
using Dataview to query templates.
3.2 Free Note Syncing (Laptop, Phone, Tablet)
No plugins used.
One of my favorite features of Obsidian is the library's self-contained and portable format. Your folder contains everything (plugins included).
Ordinary folders and documents are available as well. There is also a “.obsidian” folder. This contains all your plugins and settings, so you can use it on other devices.
So you can use Google Drive, iCloud, or Dropbox for free as long as you sync your folder (note: your folder should be in your Cloud Folder).
For my iOS and macOS work, I prefer iCloud. You can also use the paid service Obsidian Sync.
3.3 Obsidian — Managing Reading Lists and Notes in Zotero/Mendeley/JabRef
Plugins: Quotes (required).
3.3 Zotero/Mendeley/JabRef -> Obsidian — Taking Notes and Managing Reading Lists of Scientific Papers
My preferred reference manager is Zotero, but this workflow should work with any reference manager that produces a .bib file. This file is exported to my cloud folder so I can access it from any platform.
My Zotero library is tagged as follows:
My reference manager's tags
For readings, I usually search for the tags “!!!” and “To-Read” and select a paper. Annotate the paper next (either on PDF using GoodNotes or on physical paper).
Then I make a paper page using a template in the Citations plugin settings:
An example of my citations template.
Create a new note, open the command list with CMD/CTRL + P, and find the Citations “Insert literature note content in the current pane” to see this lovely view.
Citation generated by the article https://doi.org/10.1101/2022.01.24.22269144
You can then convert your notes to digital. I found that transcribing helped me retain information better.
3.4 Projects and Lab Books
Plugins: Tweaker (required).
PhD students offering advice on thesis writing are common (read as regret). I started asking them what they would have done differently or earlier.
“Deep stuff Leo,” one person said. So my main issue is basic organization, losing track of my tasks and the reasons for them.
As a result, I'd go on other experiments that didn't make sense, and have to reverse engineer my logic for thesis writing. - PhD student now wise Postdoc
Time management requires planning. Keeping track of multiple projects and lab books is difficult during a PhD. How I deal with it:
- One folder for all my projects
- One file for each project
I use a template to create each project
### [[Projects MOC]]
# <% tp.file.title %>
**Tags**::
**Links**::
**URL**::
**Project Description**::## Notes:
### <% tp.file.last_modified_date(“dddd Do MMMM YYYY”) %>
#### Done:
#### TODO:
#### Notes
You can insert a template into a new note with CMD + P and looking for the Templater option.
I then keep adding new days with another template:
### <% tp.file.last_modified_date("dddd Do MMMM YYYY") %>
#### Done:
#### TODO:
#### Notes:
This way you can keep adding days to your project and update with reasonings and things you still have to do and have done. An example below:
Example of project note with timestamped notes.
3.5 Private Encrypted Diary
This is one of my favorite Obsidian uses.
Mini Diary's interface has long frustrated me. After the author archived the project, I looked for a replacement. I had two demands:
- It had to be private, and nobody had to be able to read the entries.
- Cloud syncing was required for editing on multiple devices.
Then I learned about encrypting the Obsidian folder. Then decrypt and open the folder with Obsidian. Sync the folder as usual.
Use CryptoMator (https://cryptomator.org/). Create an encrypted folder in Cryptomator for your Obsidian vault, set a password, and let it do the rest.
If you need a step-by-step video guide, here it is:
Conclusion
So, I hope this was helpful!
In the first section of the article, we discussed notes and note-taking techniques. We discussed when to use tags and links over folders and when to break up larger notes.
Then we learned about Obsidian, its interface, and some useful plugins like Citations for citing papers and Templater for creating note templates.
Finally, we discussed workflows and how to use Zotero to take notes from scientific papers, as well as managing Lab Books and Private Encrypted Diaries.
Thanks for reading and commenting :)
Read original post here

Alex Mathers
3 years ago
8 guidelines to help you achieve your objectives 5x fast

If you waste time every day, even though you're ambitious, you're not alone.
Many of us could use some new time-management strategies, like these:
Focus on the following three.
You're thinking about everything at once.
You're overpowered.
It's mental. We just have what's in front of us. So savor the moment's beauty.
Prioritize 1-3 things.
To be one of the most productive people you and I know, follow these steps.
Get along with boredom.
Many of us grow bored, sweat, and turn on Netflix.
We shout, "I'm rarely bored!" Look at me! I'm happy.
Shut it, Sally.
You're not making wonderful things for the world. Boredom matters.
If you can sit with it for a second, you'll get insight. Boredom? Breathe.
Go blank.
Then watch your creativity grow.
Check your MacroVision once more.
We don't know what to do with our time, which contributes to time-wasting.
Nobody does, either. Jeff Bezos won't hand-deliver that crap to you.
Daily vision checks are required.
Also:
What are 5 things you'd love to create in the next 5 years?
You're soul-searching. It's food.
Return here regularly, and you'll adore the high you get from doing valuable work.
Improve your thinking.
What's Alex's latest nonsense?
I'm talking about overcoming our own thoughts. Worrying wastes so much time.
Too many of us are assaulted by lies, myths, and insecurity.
Stop letting your worries massage you into a worried coma like a Thai woman.
Optimizing your thoughts requires accepting what you can't control.
It means letting go of unhelpful thoughts and returning to the moment.
Keep your blood sugar level.
I gave up gluten, donuts, and sweets.
This has really boosted my energy.
Blood-sugar-spiking carbs make us irritable and tired.
These day-to-day ups and downs aren't productive. It's crucial.
Know how your diet affects insulin levels. Now I have more energy and can do more without clenching my teeth.
Reduce harmful carbs to boost energy.
Create a focused setting for yourself.
When we optimize the mind, we have more energy and use our time better because we're not tense.
Changing our environment can also help us focus. Disabling alerts is one example.
Too hot makes me procrastinate and irritable.
List five items that hinder your productivity.
You may be amazed at how much you may improve by removing distractions.
Be responsible.
Accountability is a time-saver.
Creating an emotional pull to finish things.
Writing down our goals makes us accountable.
We can engage a coach or work with an accountability partner to feel horrible if we don't show up and finish on time.
‘Hey Jake, I’m going to write 1000 words every day for 30 days — you need to make sure I do.’ ‘Sure thing, Nathan, I’ll be making sure you check in daily with me.’
Tick.
You might also blog about your ambitions to show your dedication.
Now you can't hide when you promised to appear.
Acquire a liking for bravery.
Boldness changes everything.
I sometimes feel lazy and wonder why. If my food and sleep are in order, I should assess my footing.
Most of us live backward. Doubtful. Uncertain. Feelings govern us.
Backfooting isn't living. It's lame, and you'll soon melt. Live boldly now.
Be assertive.
Get disgustingly into everything. Expand.
Even if it's hard, stop being a b*tch.
Those that make Mr. Bold Bear their spirit animal benefit. Save time to maximize your effect.

Deon Ashleigh
2 years ago
You can dominate your daily productivity with these 9 little-known Google Calendar tips.
Calendars are great unpaid employees.
After using Notion to organize my next three months' goals, my days were a mess.
I grew very chaotic afterward. I was overwhelmed, unsure of what to do, and wasting time attempting to plan the day after it had started.
Imagine if our skeletons were on the outside. Doesn’t work.
The goals were too big; I needed to break them into smaller chunks. But how?
Enters Google Calendar
RescueTime’s recommendations took me seven hours to make a daily planner. This epic narrative begins with a sheet of paper and concludes with a daily calendar that helps me focus and achieve more goals. Ain’t nobody got time for “what’s next?” all day.
Onward!
Return to the Paleolithic Era
Plan in writing.
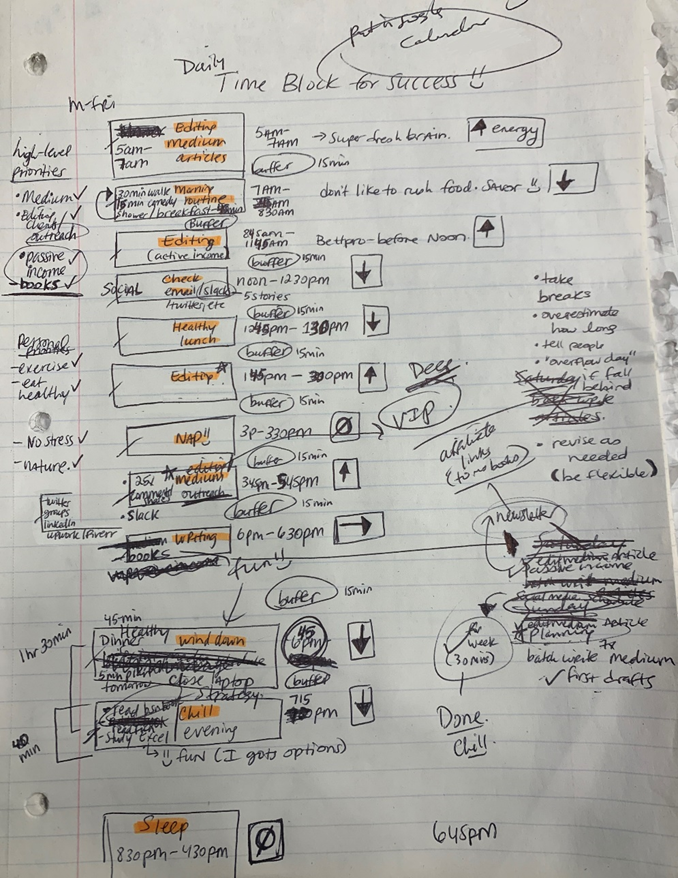
Not on the list, but it helped me plan my day. Physical writing boosts creativity and recall.
Find My Heart
i.e. prioritize
RescueTime suggested I prioritize before planning. Personal and business goals were proposed.
My top priorities are to exercise, eat healthily, spend time in nature, and avoid stress.
Priorities include writing and publishing Medium articles, conducting more freelance editing and Medium outreach, and writing/editing sci-fi books.
These eight things will help me feel accomplished every day.
Make a baby calendar.
Create daily calendar templates.
Make family, pleasure, etc. calendars.

Google Calendar instructions:
Other calendars
Press the “+” button
Create a new calendar
Create recurring events for each day
My calendar, without the template:
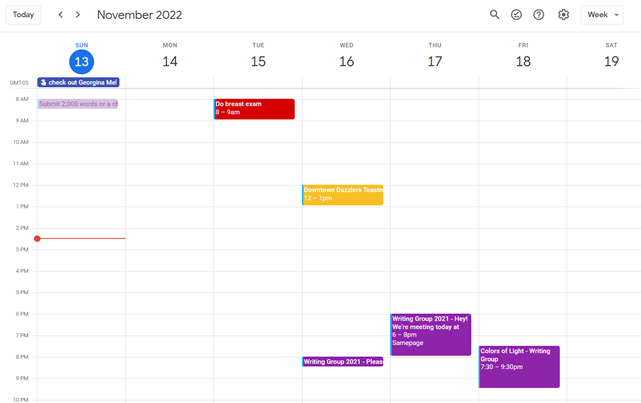
Empty, so I can fill it with vital tasks.
With the template:

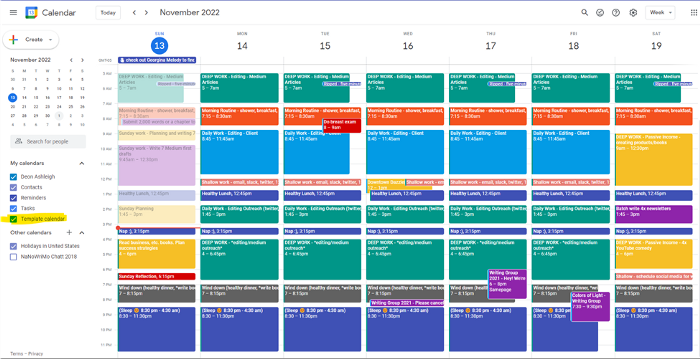
My daily skeleton corresponds with my priorities. I've been overwhelmed for years because I lack daily, weekly, monthly, and yearly structure.
Google Calendars helps me reach my goals and focus my energy.
Get your colored pencils ready
Time-block color-coding.
Color labeling lets me quickly see what's happening. Maybe you are too.
Google Calendar instructions:
Determine which colors correspond to each time block.
When establishing new events, select a color.
Save
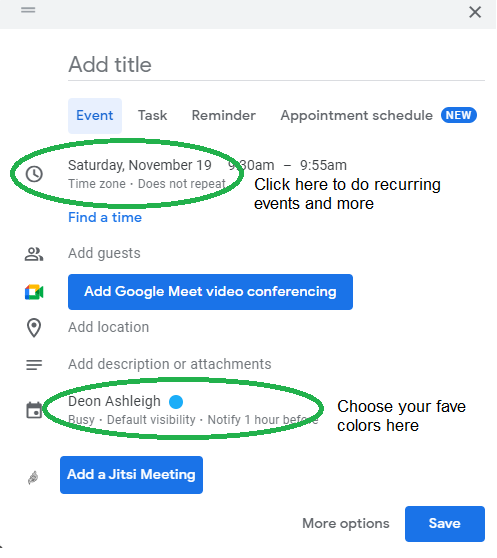
My calendar is color-coded as follows:
Yellow — passive income or other future-related activities
Red — important activities, like my monthly breast exam
Flamingo — shallow work, like emails, Twitter, etc.
Blue — all my favorite activities, like walking, watching comedy, napping, and sleeping. Oh, and eating.
Green — money-related events required for this adulting thing
Purple — writing-related stuff
Associating a time block with a color helps me stay focused. Less distractions mean faster work.
Open My Email
aka receive a daily email from Google Calendar.
Google Calendar sends a daily email feed of your calendars. I sent myself the template calendar in this email.
Google Calendar instructions:
Access settings
Select the calendar that you want to send (left side)
Go down the page to see more alerts
Under the daily agenda area, click Email.

Get in Touch With Your Red Bull Wings — Naturally
aka audit your energy levels.
My daily planner has arrows. These indicate how much energy each activity requires or how much I have.
Rightward arrow denotes medium energy.
I do my Medium and professional editing in the morning because it's energy-intensive.
Niharikaa Sodhi recommends morning Medium editing.
I’m a morning person. As long as I go to bed at a reasonable time, 5 a.m. is super wild GO-TIME. It’s like the world was just born, and I marvel at its wonderfulness.
Freelance editing lets me do what I want. An afternoon snooze will help me finish on time.
Ditch Schedule View
aka focus on the weekly view.
RescueTime advocated utilizing the weekly view of Google Calendar, so I switched.
When you launch the phone app or desktop calendar, a red line shows where you are in the day.
I'll follow the red line's instructions. My digital supervisor is easy to follow.
In the image above, it's almost 3 p.m., therefore the red line implies it's time to snooze.
I won't forget this block ;).
Reduce the Lighting
aka dim previous days.
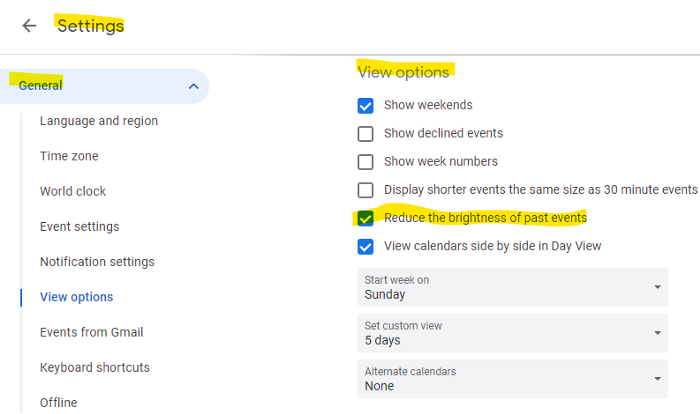
This is another Google Calendar feature I didn't know about. Once the allotted time passes, the time block dims. This keeps me present.
Google Calendar instructions:
Access settings
remaining general
To view choices, click.
Check Diminish the glare of the past.
Bonus
Two additional RescueTimes hacks:
Maintain a space between tasks
I left 15 minutes between each time block to transition smoothly. This relates to my goal of less stress. If I set strict start and end times, I'll be stressed.
With a buffer, I can breathe, stroll around, and start the following time block fresh.
Find a time is related to the buffer.
This option allows you conclude small meetings five minutes early and longer ones ten. Before the next meeting, relax or go wild.
Decide on a backup day.
This productivity technique is amazing.
Spend this excess day catching up on work. It helps reduce tension and clutter.
That's all I can say about Google Calendar's functionality.
You might also like

OnChain Wizard
3 years ago
How to make a >800 million dollars in crypto attacking the once 3rd largest stablecoin, Soros style
Everyone is talking about the $UST attack right now, including Janet Yellen. But no one is talking about how much money the attacker made (or how brilliant it was). Lets dig in.
Our story starts in late March, when the Luna Foundation Guard (or LFG) starts buying BTC to help back $UST. LFG started accumulating BTC on 3/22, and by March 26th had a $1bn+ BTC position. This is leg #1 that made this trade (or attack) brilliant.
The second leg comes in the form of the 4pool Frax announcement for $UST on April 1st. This added the second leg needed to help execute the strategy in a capital efficient way (liquidity will be lower and then the attack is on).
We don't know when the attacker borrowed 100k BTC to start the position, other than that it was sold into Kwon's buying (still speculation). LFG bought 15k BTC between March 27th and April 11th, so lets just take the average price between these dates ($42k).
So you have a ~$4.2bn short position built. Over the same time, the attacker builds a $1bn OTC position in $UST. The stage is now set to create a run on the bank and get paid on your BTC short. In anticipation of the 4pool, LFG initially removes $150mm from 3pool liquidity.
The liquidity was pulled on 5/8 and then the attacker uses $350mm of UST to drain curve liquidity (and LFG pulls another $100mm of liquidity).
But this only starts the de-pegging (down to 0.972 at the lows). LFG begins selling $BTC to defend the peg, causing downward pressure on BTC while the run on $UST was just getting started.
With the Curve liquidity drained, the attacker used the remainder of their $1b OTC $UST position ($650mm or so) to start offloading on Binance. As withdrawals from Anchor turned from concern into panic, this caused a real de-peg as people fled for the exits
So LFG is selling $BTC to restore the peg while the attacker is selling $UST on Binance. Eventually the chain gets congested and the CEXs suspend withdrawals of $UST, fueling the bank run panic. $UST de-pegs to 60c at the bottom, while $BTC bleeds out.
The crypto community panics as they wonder how much $BTC will be sold to keep the peg. There are liquidations across the board and LUNA pukes because of its redemption mechanism (the attacker very well could have shorted LUNA as well). BTC fell 25% from $42k on 4/11 to $31.3k
So how much did our attacker make? There aren't details on where they covered obviously, but if they are able to cover (or buy back) the entire position at ~$32k, that means they made $952mm on the short.
On the $350mm of $UST curve dumps I don't think they took much of a loss, lets assume 3% or just $11m. And lets assume that all the Binance dumps were done at 80c, thats another $125mm cost of doing business. For a grand total profit of $815mm (bf borrow cost).
BTC was the perfect playground for the trade, as the liquidity was there to pull it off. While having LFG involved in BTC, and foreseeing they would sell to keep the peg (and prevent LUNA from dying) was the kicker.
Lastly, the liquidity being low on 3pool in advance of 4pool allowed the attacker to drain it with only $350mm, causing the broader panic in both BTC and $UST. Any shorts on LUNA would've added a lot of P&L here as well, with it falling -65% since 5/7.
And for the reply guys, yes I know a lot of this involves some speculation & assumptions. But a lot of money was made here either way, and I thought it would be cool to dive into how they did it.

Startup Journal
3 years ago
The Top 14 Software Business Ideas That Are Sure To Succeed in 2023
Software can change any company.

Software is becoming essential. Everyone should consider how software affects their lives and others'.
Software on your phone, tablet, or computer offers many new options. We're experts in enough ways now.
Software Business Ideas will be popular by 2023.
ERP Programs
ERP software meets rising demand.
ERP solutions automate and monitor tasks that large organizations, businesses, and even schools would struggle to do manually.
ERP software could reach $49 billion by 2024.
CRM Program
CRM software is a must-have for any customer-focused business.
Having an open mind about your business services and products allows you to change platforms.
Another company may only want your CRM service.
Medical software
Healthcare facilities need reliable, easy-to-use software.
EHRs, MDDBs, E-Prescribing, and more are software options.
The global medical software market could reach $11 billion by 2025, and mobile medical apps may follow.
Presentation Software in the Cloud
SaaS presentation tools are great.
They're easy to use, comprehensive, and full of traditional Software features.
In today's cloud-based world, these solutions make life easier for people. We don't know about you, but we like it.
Software for Project Management
People began working remotely without signs or warnings before the 2020 COVID-19 pandemic.
Many organizations found it difficult to track projects and set deadlines.
With PMP software tools, teams can manage remote units and collaborate effectively.
App for Blockchain-Based Invoicing
This advanced billing and invoicing solution is for businesses and freelancers.
These blockchain-based apps can calculate taxes, manage debts, and manage transactions.
Intelligent contracts help blockchain track transactions more efficiently. It speeds up and improves invoice generation.
Software for Business Communications
Internal business messaging is tricky.
Top business software tools for communication can share files, collaborate on documents, host video conferences, and more.
Payroll Automation System
Software development also includes developing an automated payroll system.
These software systems reduce manual tasks for timely employee payments.
These tools help enterprise clients calculate total wages quickly, simplify tax calculations, improve record-keeping, and support better financial planning.
System for Detecting Data Leaks
Both businesses and individuals value data highly. Yahoo's data breach is dangerous because of this.
This area of software development can help people protect their data.
You can design an advanced data loss prevention system.
AI-based Retail System
AI-powered shopping systems are popular. The systems analyze customers' search and purchase patterns and store history and are equipped with a keyword database.
These systems offer many customers pre-loaded products.
AI-based shopping algorithms also help users make purchases.
Software for Detecting Plagiarism
Software can help ensure your projects are original and not plagiarized.
These tools detect plagiarized content that Google, media, and educational institutions don't like.
Software for Converting Audio to Text
Machine Learning converts speech to text automatically.
These programs can quickly transcribe cloud-based files.
Software for daily horoscopes
Daily and monthly horoscopes will continue to be popular.
Software platforms that can predict forecasts, calculate birth charts, and other astrology resources are good business ideas.
E-learning Programs
Traditional study methods are losing popularity as virtual schools proliferate and physical space shrinks.
Khan Academy online courses are the best way to keep learning.
Online education portals can boost your learning. If you want to start a tech startup, consider creating an e-learning program.
Conclusion
Software is booming. There's never been a better time to start a software development business, with so many people using computers and smartphones. This article lists eight business ideas for 2023. Consider these ideas if you're just starting out or looking to expand.

Tom Smykowski
2 years ago
CSS Scroll-linked Animations Will Transform The Web's User Experience
We may never tap again in ten years.
I discussed styling websites and web apps on smartwatches in my earlier article on W3C standardization.
The Parallax Chronicles
Section containing examples and flying objects
Another intriguing Working Draft I found applies to all devices, including smartphones.
These pages may have something intriguing. Take your time. Return after scrolling:
What connects these three pages?
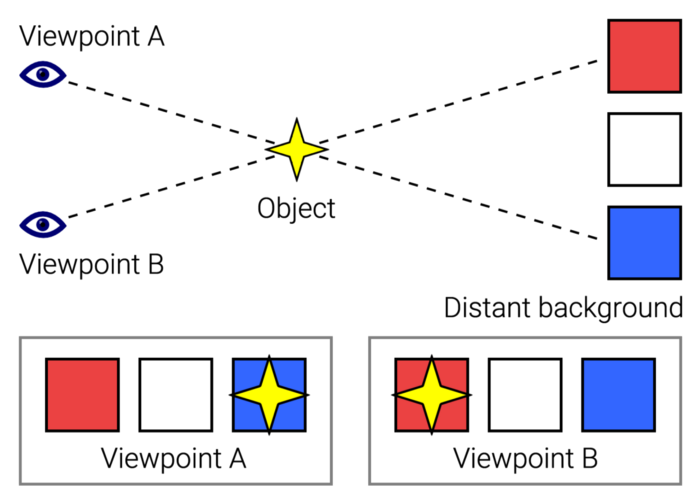
JustinWick at English Wikipedia • CC-BY-SA-3.0
Scroll-linked animation, commonly called parallax, is the effect.
WordPress theme developers' quick setup and low-code tools made the effect popular around 2014.
Parallax: Why Designers Love It
The chapter that your designer shouldn't read
Online video playback required searching, scrolling, and clicking ten years ago. Scroll and click four years ago.
Some video sites let you swipe to autoplay the next video from an endless list.
UI designers create scrollable pages and apps to accommodate the behavioral change.
Web interactivity used to be mouse-based. Clicking a button opened a help drawer, and hovering animated it.
However, a large page with more material requires fewer buttons and less interactiveness.
Designers choose scroll-based effects. Design and frontend developers must fight the trend but prepare for the worst.
How to Create Parallax
The component that you might want to show the designer
JavaScript-based effects track page scrolling and apply animations.
Javascript libraries like lax.js simplify it.
Using it needs a lot of human mathematical and physical computations.
Your asset library must also be prepared to display your website on a laptop, television, smartphone, tablet, foldable smartphone, and possibly even a microwave.
Overall, scroll-based animations can be solved better.
CSS Scroll-linked Animations
CSS makes sense since it's presentational. A Working Draft has been laying the groundwork for the next generation of interactiveness.
The new CSS property scroll-timeline powers the feature, which MDN describes well.
Before testing it, you should realize it is poorly supported:
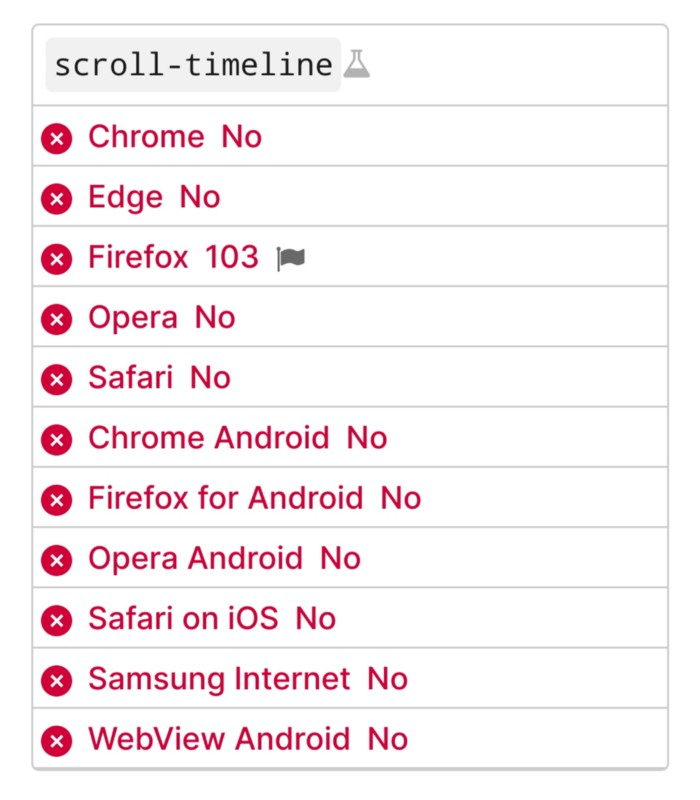
Firefox 103 currently supports it.
There is also a polyfill, with some demo examples to explore.
Summary
Web design was a protracted process. Started with pages with static backdrop images and scrollable text. Artists and designers may use the scroll-based animation CSS API to completely revamp our web experience.
It's a promising frontier. This post may attract a future scrollable web designer.
Ps. I have created flashcards for HTML, Javascript etc. Check them out!
