


More on Productivity

Simon Egersand
4 years ago
Working from home for more than two years has taught me a lot.
Since the pandemic, I've worked from home. It’s been +2 years (wow, time flies!) now, and during this time I’ve learned a lot. My 4 remote work lessons.
I work in a remote distributed team. This team setting shaped my experience and teachings.
Isolation ("I miss my coworkers")
The most obvious point. I miss going out with my coworkers for coffee, weekend chats, or just company while I work. I miss being able to go to someone's desk and ask for help. On a remote world, I must organize a meeting, share my screen, and avoid talking over each other in Zoom - sigh!
Social interaction is more vital for my health than I believed.
Online socializing stinks
My company used to come together every Friday to play Exploding Kittens, have food and beer, and bond over non-work things.
Different today. Every Friday afternoon is for fun, but it's not the same. People with screen weariness miss meetings, which makes sense. Sometimes you're too busy on Slack to enjoy yourself.
We laugh in meetings, but it's not the same as face-to-face.
Digital social activities can't replace real-world ones
Improved Work-Life Balance, if You Let It
At the outset of the pandemic, I recognized I needed to take better care of myself to survive. After not leaving my apartment for a few days and feeling miserable, I decided to walk before work every day. This turned into a passion for exercise, and today I run or go to the gym before work. I use my commute time for healthful activities.
Working from home makes it easier to keep working after hours. I sometimes forget the time and find myself writing coding at dinnertime. I said, "One more test." This is a disadvantage, therefore I keep my office schedule.
Spend your commute time properly and keep to your office schedule.
Remote Pair Programming Is Hard
As a software developer, I regularly write code. My team sometimes uses pair programming to write code collaboratively. One person writes code while another watches, comments, and asks questions. I won't list them all here.
Internet pairing is difficult. My team struggles with this. Even with Tuple, it's challenging. I lose attention when I get a notification or check my computer.
I miss a pen and paper to rapidly sketch down my thoughts for a colleague or a whiteboard for spirited talks with others. Best answers are found through experience.
Real-life pair programming beats the best remote pair programming tools.
Lessons Learned
Here are 4 lessons I've learned working remotely for 2 years.
-
Socializing is more vital to my health than I anticipated.
-
Digital social activities can't replace in-person ones.
-
Spend your commute time properly and keep your office schedule.
-
Real-life pair programming beats the best remote tools.
Conclusion
Our era is fascinating. Remote labor has existed for years, but software companies have just recently had to adapt. Companies who don't offer remote work will lose talent, in my opinion.
We're still figuring out the finest software development approaches, programming language features, and communication methods since the 1960s. I can't wait to see what advancements assist us go into remote work.
I'll certainly work remotely in the next years, so I'm interested to see what I've learnt from this post then.
This post is a summary of this one.

Dr Mehmet Yildiz
3 years ago
How I train my brain daily for clarity and productivity.
I use a conceptual and practical system I developed decades ago as an example.
Since childhood, I've been interested in the brain-mind connection, so I developed a system using scientific breakthroughs, experiments, and the experiences of successful people in my circles.
This story provides a high-level overview of a custom system to inform and inspire readers. Creating a mind gym was one of my best personal and professional investments.
Such a complex system may not be possible for everyone or appear luxurious at first. However, the process and approach may help you find more accessible and viable solutions.
Visualizing the brain as a muscle, I learned to stimulate it with physical and mental exercises, applying a new mindset and behavioral changes.
My methods and practices may not work for others because we're all different. I focus on the approach's principles and highlights so you can create your own program.
Some create a conceptual and practical system intuitively, and others intellectually. Both worked. I see intellect and intuition as higher selves.
The mental tools I introduce are based on lifestyle changes and can be personalized by anyone, barring physical constraints or underlying health conditions.
Some people can't meditate despite wanting to due to mental constraints. This story lacks exceptions.
People's systems may vary. Many have used my tools successfully. All have scientific backing because their benefits attracted scientists. None are unethical or controversial.
My focus is cognition, which is the neocortex's ability. These practices and tools can affect the limbic and reptilian brain regions.
A previous article discussed brain health's biological aspects. This article focuses on psychology.
Thinking, learning, and remembering are cognitive abilities. Cognitive abilities determine our health and performance.
Cognitive health is the ability to think, concentrate, learn, and remember. Cognitive performance boosting involves various tools and processes. My system and protocols address cognitive health and performance.
As a biological organ, the brain's abilities decline with age, especially if not used regularly. Older people have more neurodegenerative disorders like dementia.
As aging is inevitable, I focus on creating cognitive reserves to remain mentally functional as we age and face mental decline or cognitive impairment.
My protocols focus on neurogenesis, or brain growth and maintenance. Neurons and connections can grow at any age.
Metacognition refers to knowing our cognitive abilities, like thinking about thinking and learning how to learn.
In the following sections, I provide an overview of my system, mental tools, and protocols.
This system summarizes my 50-year career. Some may find it too abstract, so I give examples.
First, explain the system. Section 2 introduces activities. Third, how to measure and maintain mental growth.
1 — Developed a practical mental gym.
The mental gym is a metaphor for the physical fitness gym to improve our mental muscles.
This concept covers brain and mind functionality. Integrated biological and psychological components.
I'll describe my mental gym so my other points make sense. My mental gym has physical and mental tools.
Mindfulness, meditation, visualization, self-conversations, breathing exercises, expressive writing, working in a flow state, reading, music, dance, isometric training, barefoot walking, cold/heat exposure, CBT, and social engagements are regular tools.
Dancing, walking, and thermogenesis are body-related tools. As the brain is part of the body and houses the mind, these tools can affect mental abilities such as attention, focus, memory, task switching, and problem-solving.
Different people may like different tools. I chose these tools based on my needs, goals, and lifestyle. They're just examples. You can choose tools that fit your goals and personality.
2 — Performed tasks regularly.
These tools gave me clarity. They became daily hobbies. Some I did alone, others with others.
Some examples: I meditate daily. Even though my overactive mind made daily meditation difficult at first, I now enjoy it. Meditation three times a day sharpens my mind.
Self-talk is used for self-therapy and creativity. Self-talk was initially difficult, but neurogenesis rewired my brain to make it a habit.
Cold showers, warm baths with Epsom salts, fasting, barefoot walks on the beach or grass, dancing, calisthenics, trampoline hopping, and breathing exercises increase my mental clarity, creativity, and productivity.
These exercises can increase BDNF, which promotes nervous system growth. They improve mental capacity and performance by increasing blood flow and brain oxygenation.
I use weekly and occasional activities like dry saunas, talking with others, and community activities.
These activities stimulate the brain and mind, improving performance and cognitive capacity.
3 — Measured progress, set growth goals.
Measuring progress helps us stay on track. Without data, it's hard to stay motivated. When we face inevitable setbacks, we may abandon our dreams.
I created a daily checklist for a spreadsheet with macros. I tracked how often and long I did each activity.
I measured my progress objectively and subjectively. In the progress spreadsheet, I noted my meditation hours and subjective feelings.
In another column, I used good, moderate, and excellent to get qualitative data. It took time and effort. Later, I started benefiting from this automated structure.
Creating a page for each activity, such as meditation, self-talk, cold showers, walking, expressive writing, personal interactions, etc., gave me empirical data I could analyze, modify, and graph to show progress.
Colored charts showed each area's strengths and weaknesses.
Strengths motivate me to continue them. Identifying weaknesses helped me improve them.
As the system matured, data recording became a habit and took less time. I saw the result immediately because I automated the charts when I entered daily data. Early time investment paid off later.
Mind Gym Benefits, Effective Use, and Progress Measuring
This concept helped me move from comfort to risk. I accept things as they are.
Turnarounds were made. I stopped feeling "Fight-Flight-Freeze" and maintained self-control.
I tamed my overactive amygdala by strengthening my brain. Stress and anxiety decreased. With these shifts, I accepted criticism and turned envy into admiration. Clarity improved.
When the cognitive part of the brain became stronger and the primitive part was tamed, managing thoughts and emotions became easier. My AQ increased. I learned to tolerate people, physical, mental, and emotional obstacles.
Accessing vast information sources in my subconscious mind through an improved RAS allowed me to easily tap into my higher self and recognize flaws in my lower self.
Summary
The brain loves patterns and routines, so habits help. Observing, developing, and monitoring habits mindfully can be beneficial. Mindfulness helps us achieve this goal systematically.
As body and mind are connected, we must consider both when building habits. Consistent and joyful practices can strengthen neurons and neural connections.
Habits help us accomplish more with less effort. Regularly using mental tools and processes can improve our cognitive health and performance as we age.
Creating daily habits to improve cognitive abilities can sharpen our minds and boost our well-being.
Some apps monitor our activities and behavior to help build habits. If you can't replicate my system, try these apps. Some smartwatches and fitness devices include them.
Set aside time each day for mental activities you enjoy. Regular scheduling and practice can strengthen brain regions and form habits. Once you form habits, tasks become easy.
Improving our minds is a lifelong journey. It's easier and more sustainable to increase our efforts daily, weekly, monthly, or annually.
Despite life's ups and downs, many want to remain calm and cheerful.
This valuable skill is unrelated to wealth or fame. It's about our mindset, fueled by our biological and psychological needs.
Here are some lessons I've learned about staying calm and composed despite challenges and setbacks.
1 — Tranquillity starts with observing thoughts and feelings.
2 — Clear the mental clutter and emotional entanglements with conscious breathing and gentle movements.
3 — Accept situations and events as they are with no resistance.
4 — Self-love can lead to loving others and increasing compassion.
5 — Count your blessings and cultivate gratitude.
Clear thinking can bring joy and satisfaction. It's a privilege to wake up with a healthy body and clear mind, ready to connect with others and serve them.
Thank you for reading my perspectives. I wish you a healthy and happy life.
Jumanne Rajabu Mtambalike
4 years ago
10 Years of Trying to Manage Time and Improve My Productivity.
I've spent the last 10 years of my career mastering time management. I've tried different approaches and followed multiple people and sources. My knowledge is summarized.
Great people, including entrepreneurs, master time management. I learned time management in college. I was studying Computer Science and Finance and leading Tanzanian students in Bangalore, India. I had 24 hours per day to do this and enjoy campus. I graduated and received several awards. I've learned to maximize my time. These tips and tools help me finish quickly.
Eisenhower-Box
I don't remember when I read the article. James Clear, one of my favorite bloggers, introduced me to the Eisenhower Box, which I've used for years. Eliminate waste to master time management. By grouping your activities by importance and urgency, the tool helps you prioritize what matters and drop what doesn't. If it's urgent, do it. Delegate if it's urgent but not necessary. If it's important but not urgent, reschedule it; otherwise, drop it. I integrated the tool with Trello to manage my daily tasks. Since 2007, I've done this.
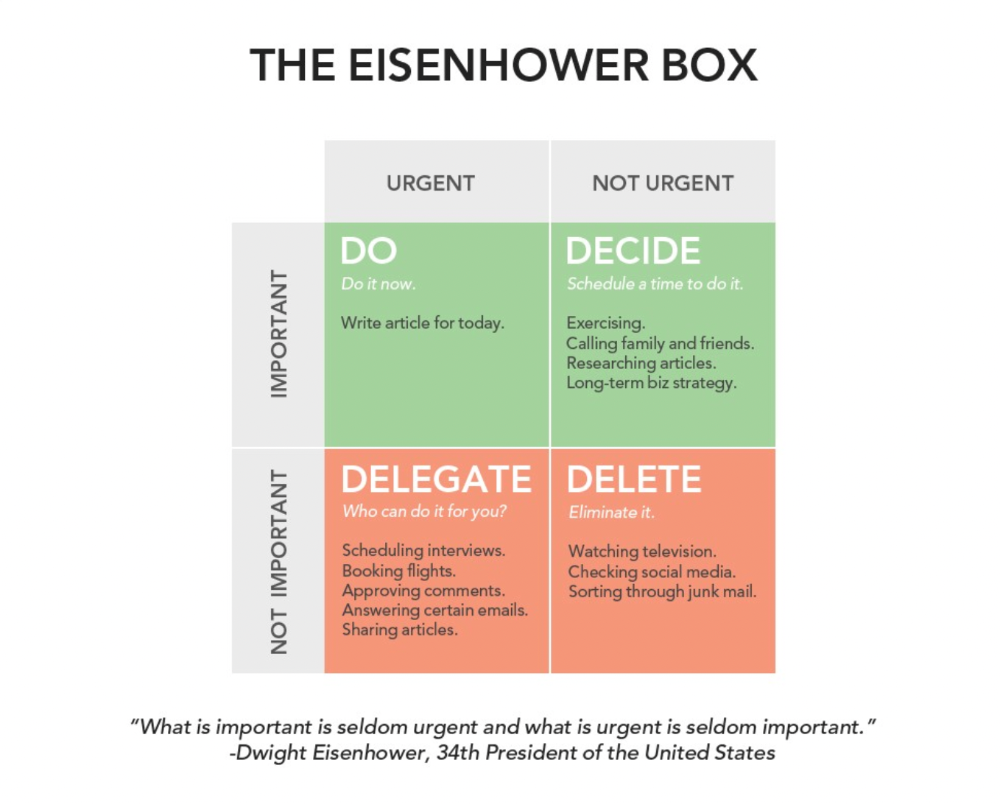
James Clear's article mentions Eisenhower Box.
Essentialism rules
Greg McKeown's book Essentialism introduced me to disciplined pursuit of less. I once wrote about this. I wasn't sure what my career's real opportunities and distractions were. A non-essentialist thinks everything is essential; you want to be everything to everyone, and your life lacks satisfaction. Poor time management starts it all. Reading and applying this book will change your life.
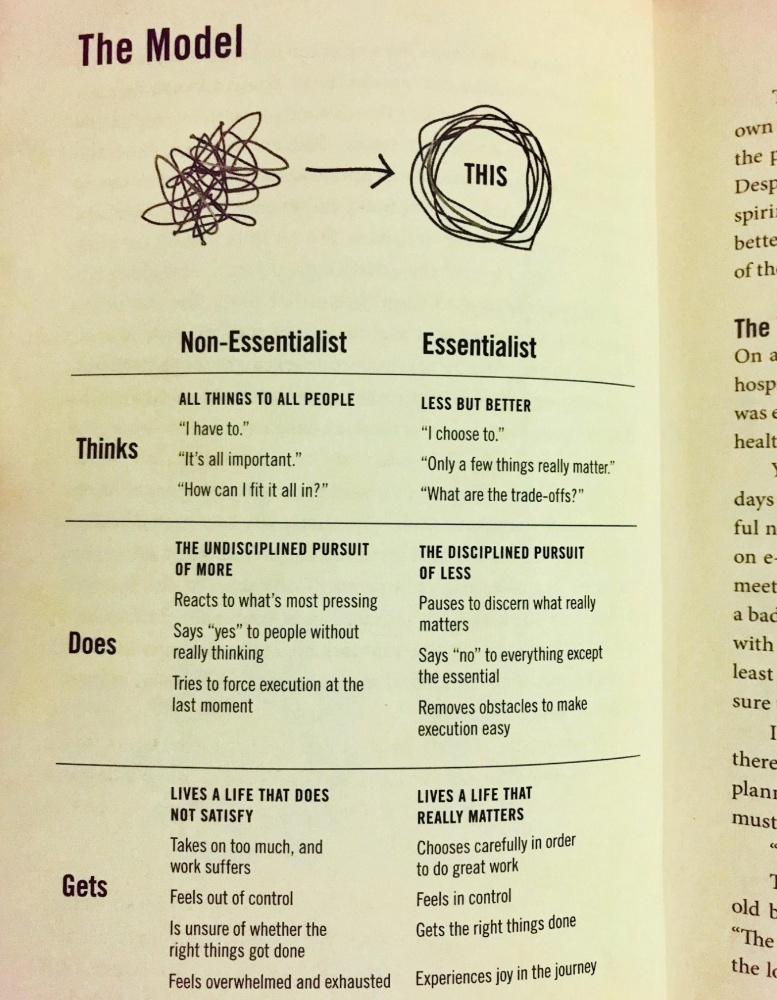
Essential vs non-essential
Life Calendar
Most of us make corporate calendars. Peter Njonjo, founder of Twiga Foods, said he manages time by putting life activities in his core calendars. It includes family retreats, weddings, and other events. He joked that his wife always complained to him to avoid becoming a calendar item. It's key. "Time Masters" manages life's four burners, not just work and corporate life. There's no "work-life balance"; it's life.
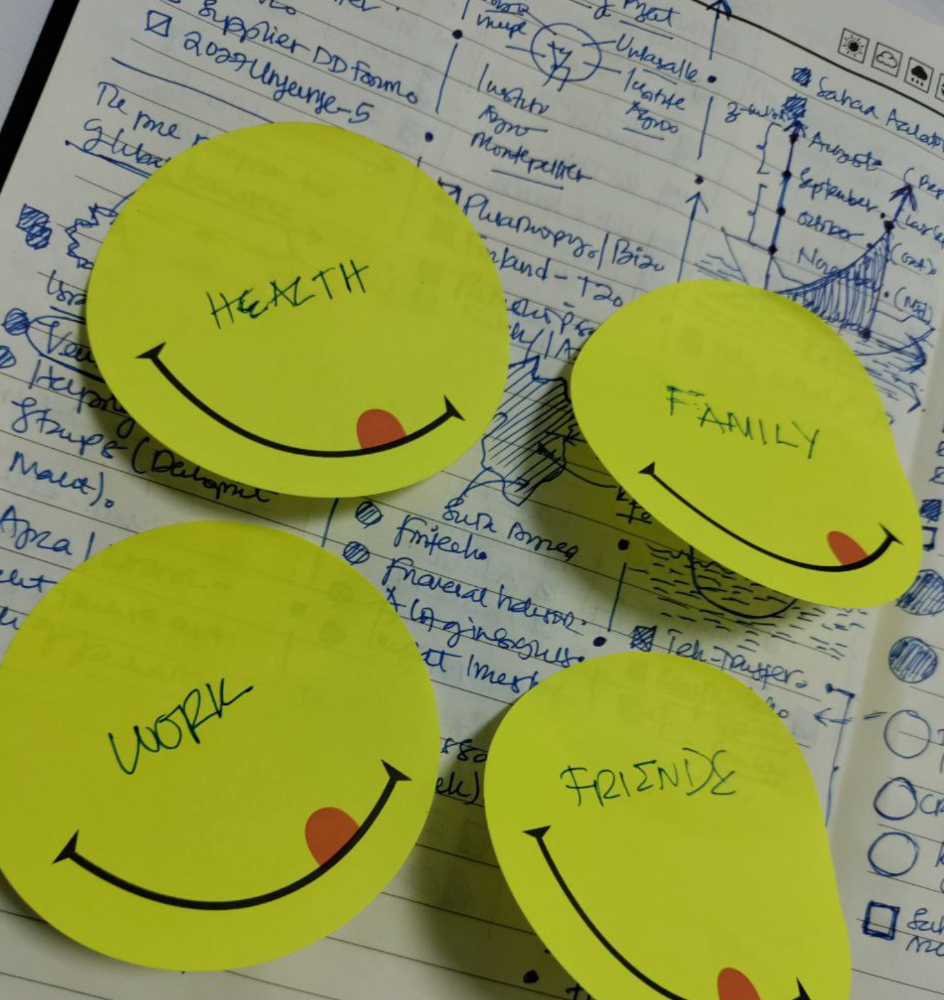
Health, Family, Work, and Friends.
The Brutal No
In a culture where people want to look good, saying "NO" to a favor request seems rude. In reality, the crime is breaking a promise. "Time Masters" have mastered "NO". More "YES" means less time, and more "NO" means more time for tasks and priorities. Brutal No doesn't mean being mean to your coworkers; it means explaining kindly and professionally that you have other priorities.
To-Do vs. MITs
Most people are productive with a routine to-do list. You can't be effective by just checking boxes on a To-do list. When was the last time you completed all of your daily tasks? Never. You must replace the to-do list with Most Important Tasks (MITs). MITs allow you to focus on the most important tasks on your list. You feel progress and accomplishment when you finish these tasks. MITs don't include ad-hoc emails, meetings, etc.
Journal Mapped
Most people don't journal or plan their day in the developing South. I've learned to plan my day in my journal over time. I have multiple sections on one page: MITs (things I want to accomplish that day), Other Activities (stuff I can postpone), Life (health, faith, and family issues), and Pop-Ups (things that just pop up). I leave the next page blank for notes. I reflected on the blocks to identify areas to improve the next day. You will have bad days, but at least you'll realize it was due to poor time management.
Buy time/delegate
Time or money? When you make enough money, you lose time to make more. The smart buy "Time." I resisted buying other people's time for years. I regret not hiring an assistant sooner. Learn to buy time from others and pay for time-consuming tasks. Sometimes you think you're saving money by doing things yourself, but you're actually losing money.
This post is a summary. See the full post here.
You might also like
Matthew Royse
4 years ago
5 Tips for Concise Writing
Here's how to be clear.
“I have only made this letter longer because I have not had the time to make it shorter.” — French mathematician, physicist, inventor, philosopher, and writer Blaise Pascal
Concise.
People want this. We tend to repeat ourselves and use unnecessary words.
Being vague frustrates readers. It focuses their limited attention span on figuring out what you're saying rather than your message.
Edit carefully.
“Examine every word you put on paper. You’ll find a surprising number that don’t serve any purpose.” — American writer, editor, literary critic, and teacher William Zinsser
How do you write succinctly?
Here are three ways to polish your writing.
1. Delete
Your readers will appreciate it if you delete unnecessary words. If a word or phrase is essential, keep it. Don't force it.
Many readers dislike bloated sentences. Ask yourself if cutting a word or phrase will change the meaning or dilute your message.
For example, you could say, “It’s absolutely essential that I attend this meeting today, so I know the final outcome.” It’s better to say, “It’s critical I attend the meeting today, so I know the results.”
Key takeaway
Delete actually, completely, just, full, kind of, really, and totally. Keep the necessary words, cut the rest.
2. Just Do It
Don't tell readers your plans. Your readers don't need to know your plans. Who are you?
Don't say, "I want to highlight our marketing's problems." Our marketing issues are A, B, and C. This cuts 5–7 words per sentence.
Keep your reader's attention on the essentials, not the fluff. What are you doing? You won't lose readers because you get to the point quickly and don't build up.
Key takeaway
Delete words that don't add to your message. Do something, don't tell readers you will.
3. Cut Overlap
You probably repeat yourself unintentionally. You may add redundant sentences when brainstorming. Read aloud to detect overlap.
Remove repetition from your writing. It's important to edit our writing and thinking to avoid repetition.
Key Takeaway
If you're repeating yourself, combine sentences to avoid overlap.
4. Simplify
Write as you would to family or friends. Communicate clearly. Don't use jargon. These words confuse readers.
Readers want specifics, not jargon. Write simply. Done.
Most adults read at 8th-grade level. Jargon and buzzwords make speech fluffy. This confuses readers who want simple language.
Key takeaway
Ensure all audiences can understand you. USA Today's 5th-grade reading level is intentional. They want everyone to understand.
5. Active voice
Subjects perform actions in active voice. When you write in passive voice, the subject receives the action.
For example, “the board of directors decided to vote on the topic” is an active voice, while “a decision to vote on the topic was made by the board of directors” is a passive voice.
Key takeaway
Active voice clarifies sentences. Active voice is simple and concise.
Bringing It All Together
Five tips help you write clearly. Delete, just do it, cut overlap, use simple language, and write in an active voice.
Clear writing is effective. It's okay to occasionally use unnecessary words or phrases. Realizing it is key. Check your writing.
Adding words costs.
Write more concisely. People will appreciate it and read your future articles, emails, and messages. Spending extra time will increase trust and influence.
“Not that the story need be long, but it will take a long while to make it short.” — Naturalist, essayist, poet, and philosopher Henry David Thoreau

Farhan Ali Khan
3 years ago
Introduction to Zero-Knowledge Proofs: The Art of Proving Without Revealing
Zero-Knowledge Proofs for Beginners
Published here originally.
Introduction
I Spy—did you play as a kid? One person chose a room object, and the other had to guess it by answering yes or no questions. I Spy was entertaining, but did you know it could teach you cryptography?
Zero Knowledge Proofs let you show your pal you know what they picked without exposing how. Math replaces electronics in this secret spy mission. Zero-knowledge proofs (ZKPs) are sophisticated cryptographic tools that allow one party to prove they have particular knowledge without revealing it. This proves identification and ownership, secures financial transactions, and more. This article explains zero-knowledge proofs and provides examples to help you comprehend this powerful technology.
What is a Proof of Zero Knowledge?
Zero-knowledge proofs prove a proposition is true without revealing any other information. This lets the prover show the verifier that they know a fact without revealing it. So, a zero-knowledge proof is like a magician's trick: the prover proves they know something without revealing how or what. Complex mathematical procedures create a proof the verifier can verify.
Want to find an easy way to test it out? Try out with tis awesome example! ZK Crush
Describe it as if I'm 5
Alex and Jack found a cave with a center entrance that only opens when someone knows the secret. Alex knows how to open the cave door and wants to show Jack without telling him.
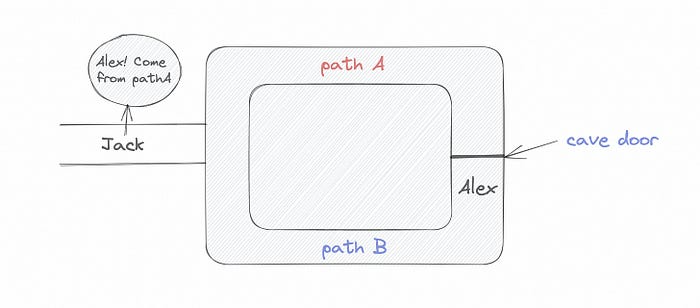
Alex and Jack name both pathways (let’s call them paths A and B).
In the first phase, Alex is already inside the cave and is free to select either path, in this case A or B.
As Alex made his decision, Jack entered the cave and asked him to exit from the B path.
Jack can confirm that Alex really does know the key to open the door because he came out for the B path and used it.
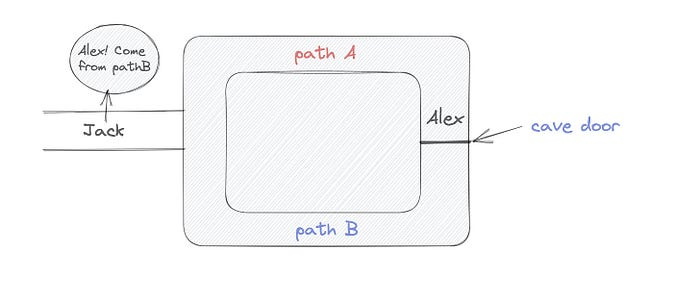
To conclude, Alex and Jack repeat:
Alex walks into the cave.
Alex follows a random route.
Jack walks into the cave.
Alex is asked to follow a random route by Jack.
Alex follows Jack's advice and heads back that way.
What is a Zero Knowledge Proof?
At a high level, the aim is to construct a secure and confidential conversation between the prover and the verifier, where the prover convinces the verifier that they have the requisite information without disclosing it. The prover and verifier exchange messages and calculate in each round of the dialogue.
The prover uses their knowledge to prove they have the information the verifier wants during these rounds. The verifier can verify the prover's truthfulness without learning more by checking the proof's mathematical statement or computation.
Zero knowledge proofs use advanced mathematical procedures and cryptography methods to secure communication. These methods ensure the evidence is authentic while preventing the prover from creating a phony proof or the verifier from extracting unnecessary information.
ZK proofs require examples to grasp. Before the examples, there are some preconditions.
Criteria for Proofs of Zero Knowledge
Completeness: If the proposition being proved is true, then an honest prover will persuade an honest verifier that it is true.
Soundness: If the proposition being proved is untrue, no dishonest prover can persuade a sincere verifier that it is true.
Zero-knowledge: The verifier only realizes that the proposition being proved is true. In other words, the proof only establishes the veracity of the proposition being supported and nothing more.
The zero-knowledge condition is crucial. Zero-knowledge proofs show only the secret's veracity. The verifier shouldn't know the secret's value or other details.
Example after example after example
To illustrate, take a zero-knowledge proof with several examples:
Initial Password Verification Example
You want to confirm you know a password or secret phrase without revealing it.
Use a zero-knowledge proof:
You and the verifier settle on a mathematical conundrum or issue, such as figuring out a big number's components.
The puzzle or problem is then solved using the hidden knowledge that you have learned. You may, for instance, utilize your understanding of the password to determine the components of a particular number.
You provide your answer to the verifier, who can assess its accuracy without knowing anything about your private data.
You go through this process several times with various riddles or issues to persuade the verifier that you actually are aware of the secret knowledge.
You solved the mathematical puzzles or problems, proving to the verifier that you know the hidden information. The proof is zero-knowledge since the verifier only sees puzzle solutions, not the secret information.
In this scenario, the mathematical challenge or problem represents the secret, and solving it proves you know it. The evidence does not expose the secret, and the verifier just learns that you know it.
My simple example meets the zero-knowledge proof conditions:
Completeness: If you actually know the hidden information, you will be able to solve the mathematical puzzles or problems, hence the proof is conclusive.
Soundness: The proof is sound because the verifier can use a publicly known algorithm to confirm that your answer to the mathematical conundrum or difficulty is accurate.
Zero-knowledge: The proof is zero-knowledge because all the verifier learns is that you are aware of the confidential information. Beyond the fact that you are aware of it, the verifier does not learn anything about the secret information itself, such as the password or the factors of the number. As a result, the proof does not provide any new insights into the secret.
Explanation #2: Toss a coin.
One coin is biased to come up heads more often than tails, while the other is fair (i.e., comes up heads and tails with equal probability). You know which coin is which, but you want to show a friend you can tell them apart without telling them.
Use a zero-knowledge proof:
One of the two coins is chosen at random, and you secretly flip it more than once.
You show your pal the following series of coin flips without revealing which coin you actually flipped.
Next, as one of the two coins is flipped in front of you, your friend asks you to tell which one it is.
Then, without revealing which coin is which, you can use your understanding of the secret order of coin flips to determine which coin your friend flipped.
To persuade your friend that you can actually differentiate between the coins, you repeat this process multiple times using various secret coin-flipping sequences.
In this example, the series of coin flips represents the knowledge of biased and fair coins. You can prove you know which coin is which without revealing which is biased or fair by employing a different secret sequence of coin flips for each round.
The evidence is zero-knowledge since your friend does not learn anything about which coin is biased and which is fair other than that you can tell them differently. The proof does not indicate which coin you flipped or how many times you flipped it.
The coin-flipping example meets zero-knowledge proof requirements:
Completeness: If you actually know which coin is biased and which is fair, you should be able to distinguish between them based on the order of coin flips, and your friend should be persuaded that you can.
Soundness: Your friend may confirm that you are correctly recognizing the coins by flipping one of them in front of you and validating your answer, thus the proof is sound in that regard. Because of this, your acquaintance can be sure that you are not just speculating or picking a coin at random.
Zero-knowledge: The argument is that your friend has no idea which coin is biased and which is fair beyond your ability to distinguish between them. Your friend is not made aware of the coin you used to make your decision or the order in which you flipped the coins. Consequently, except from letting you know which coin is biased and which is fair, the proof does not give any additional information about the coins themselves.
Figure out the prime number in Example #3.
You want to prove to a friend that you know their product n=pq without revealing p and q. Zero-knowledge proof?
Use a variant of the RSA algorithm. Method:
You determine a new number s = r2 mod n by computing a random number r.
You email your friend s and a declaration that you are aware of the values of p and q necessary for n to equal pq.
A random number (either 0 or 1) is selected by your friend and sent to you.
You send your friend r as evidence that you are aware of the values of p and q if e=0. You calculate and communicate your friend's s/r if e=1.
Without knowing the values of p and q, your friend can confirm that you know p and q (in the case where e=0) or that s/r is a legitimate square root of s mod n (in the situation where e=1).
This is a zero-knowledge proof since your friend learns nothing about p and q other than their product is n and your ability to verify it without exposing any other information. You can prove that you know p and q by sending r or by computing s/r and sending that instead (if e=1), and your friend can verify that you know p and q or that s/r is a valid square root of s mod n without learning anything else about their values. This meets the conditions of completeness, soundness, and zero-knowledge.
Zero-knowledge proofs satisfy the following:
Completeness: The prover can demonstrate this to the verifier by computing q = n/p and sending both p and q to the verifier. The prover also knows a prime number p and a factorization of n as p*q.
Soundness: Since it is impossible to identify any pair of numbers that correctly factorize n without being aware of its prime factors, the prover is unable to demonstrate knowledge of any p and q that do not do so.
Zero knowledge: The prover only admits that they are aware of a prime number p and its associated factor q, which is already known to the verifier. This is the extent of their knowledge of the prime factors of n. As a result, the prover does not provide any new details regarding n's prime factors.
Types of Proofs of Zero Knowledge
Each zero-knowledge proof has pros and cons. Most zero-knowledge proofs are:
Interactive Zero Knowledge Proofs: The prover and the verifier work together to establish the proof in this sort of zero-knowledge proof. The verifier disputes the prover's assertions after receiving a sequence of messages from the prover. When the evidence has been established, the prover will employ these new problems to generate additional responses.
Non-Interactive Zero Knowledge Proofs: For this kind of zero-knowledge proof, the prover and verifier just need to exchange a single message. Without further interaction between the two parties, the proof is established.
A statistical zero-knowledge proof is one in which the conclusion is reached with a high degree of probability but not with certainty. This indicates that there is a remote possibility that the proof is false, but that this possibility is so remote as to be unimportant.
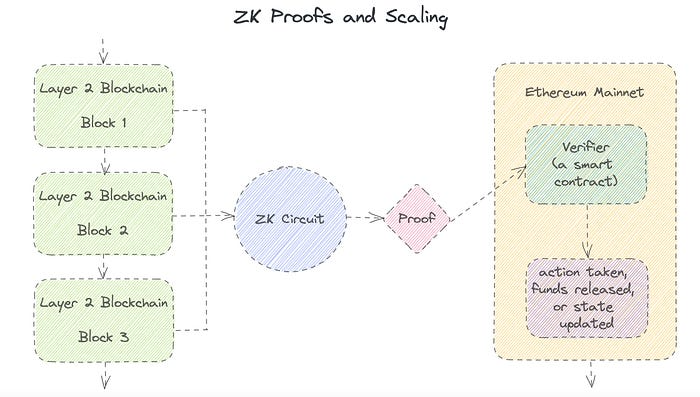
Succinct Non-Interactive Argument of Knowledge (SNARKs): SNARKs are an extremely effective and scalable form of zero-knowledge proof. They are utilized in many different applications, such as machine learning, blockchain technology, and more. Similar to other zero-knowledge proof techniques, SNARKs enable one party—the prover—to demonstrate to another—the verifier—that they are aware of a specific piece of information without disclosing any more information about that information.
The main characteristic of SNARKs is their succinctness, which refers to the fact that the size of the proof is substantially smaller than the amount of the original data being proved. Because to its high efficiency and scalability, SNARKs can be used in a wide range of applications, such as machine learning, blockchain technology, and more.
Uses for Zero Knowledge Proofs
ZKP applications include:
Verifying Identity ZKPs can be used to verify your identity without disclosing any personal information. This has uses in access control, digital signatures, and online authentication.
Proof of Ownership ZKPs can be used to demonstrate ownership of a certain asset without divulging any details about the asset itself. This has uses for protecting intellectual property, managing supply chains, and owning digital assets.
Financial Exchanges Without disclosing any details about the transaction itself, ZKPs can be used to validate financial transactions. Cryptocurrency, internet payments, and other digital financial transactions can all use this.
By enabling parties to make calculations on the data without disclosing the data itself, Data Privacy ZKPs can be used to preserve the privacy of sensitive data. Applications for this can be found in the financial, healthcare, and other sectors that handle sensitive data.
By enabling voters to confirm that their vote was counted without disclosing how they voted, elections ZKPs can be used to ensure the integrity of elections. This is applicable to electronic voting, including internet voting.
Cryptography Modern cryptography's ZKPs are a potent instrument that enable secure communication and authentication. This can be used for encrypted messaging and other purposes in the business sector as well as for military and intelligence operations.
Proofs of Zero Knowledge and Compliance
Kubernetes and regulatory compliance use ZKPs in many ways. Examples:
Security for Kubernetes ZKPs offer a mechanism to authenticate nodes without disclosing any sensitive information, enhancing the security of Kubernetes clusters. ZKPs, for instance, can be used to verify, without disclosing the specifics of the program, that the nodes in a Kubernetes cluster are running permitted software.
Compliance Inspection Without disclosing any sensitive information, ZKPs can be used to demonstrate compliance with rules like the GDPR, HIPAA, and PCI DSS. ZKPs, for instance, can be used to demonstrate that data has been encrypted and stored securely without divulging the specifics of the mechanism employed for either encryption or storage.
Access Management Without disclosing any private data, ZKPs can be used to offer safe access control to Kubernetes resources. ZKPs can be used, for instance, to demonstrate that a user has the necessary permissions to access a particular Kubernetes resource without disclosing the details of those permissions.
Safe Data Exchange Without disclosing any sensitive information, ZKPs can be used to securely transmit data between Kubernetes clusters or between several businesses. ZKPs, for instance, can be used to demonstrate the sharing of a specific piece of data between two parties without disclosing the details of the data itself.
Kubernetes deployments audited Without disclosing the specifics of the deployment or the data being processed, ZKPs can be used to demonstrate that Kubernetes deployments are working as planned. This can be helpful for auditing purposes and for ensuring that Kubernetes deployments are operating as planned.
ZKPs preserve data and maintain regulatory compliance by letting parties prove things without revealing sensitive information. ZKPs will be used more in Kubernetes as it grows.

Jonathan Vanian
4 years ago
What is Terra? Your guide to the hot cryptocurrency
With cryptocurrencies like Bitcoin, Ether, and Dogecoin gyrating in value over the past few months, many people are looking at so-called stablecoins like Terra to invest in because of their more predictable prices.
Terraform Labs, which oversees the Terra cryptocurrency project, has benefited from its rising popularity. The company said recently that investors like Arrington Capital, Lightspeed Venture Partners, and Pantera Capital have pledged $150 million to help it incubate various crypto projects that are connected to Terra.
Terraform Labs and its partners have built apps that operate on the company’s blockchain technology that helps keep a permanent and shared record of the firm’s crypto-related financial transactions.
Here’s what you need to know about Terra and the company behind it.
What is Terra?
Terra is a blockchain project developed by Terraform Labs that powers the startup’s cryptocurrencies and financial apps. These cryptocurrencies include the Terra U.S. Dollar, or UST, that is pegged to the U.S. dollar through an algorithm.
Terra is a stablecoin that is intended to reduce the volatility endemic to cryptocurrencies like Bitcoin. Some stablecoins, like Tether, are pegged to more conventional currencies, like the U.S. dollar, through cash and cash equivalents as opposed to an algorithm and associated reserve token.
To mint new UST tokens, a percentage of another digital token and reserve asset, Luna, is “burned.” If the demand for UST rises with more people using the currency, more Luna will be automatically burned and diverted to a community pool. That balancing act is supposed to help stabilize the price, to a degree.
“Luna directly benefits from the economic growth of the Terra economy, and it suffers from contractions of the Terra coin,” Terraform Labs CEO Do Kwon said.
Each time someone buys something—like an ice cream—using UST, that transaction generates a fee, similar to a credit card transaction. That fee is then distributed to people who own Luna tokens, similar to a stock dividend.
Who leads Terra?
The South Korean firm Terraform Labs was founded in 2018 by Daniel Shin and Kwon, who is now the company’s CEO. Kwon is a 29-year-old former Microsoft employee; Shin now heads the Chai online payment service, a Terra partner. Kwon said many Koreans have used the Chai service to buy goods like movie tickets using Terra cryptocurrency.
Terraform Labs does not make money from transactions using its crypto and instead relies on outside funding to operate, Kwon said. It has raised $57 million in funding from investors like HashKey Digital Asset Group, Divergence Digital Currency Fund, and Huobi Capital, according to deal-tracking service PitchBook. The amount raised is in addition to the latest $150 million funding commitment announced on July 16.
What are Terra’s plans?
Terraform Labs plans to use Terra’s blockchain and its associated cryptocurrencies—including one pegged to the Korean won—to create a digital financial system independent of major banks and fintech-app makers. So far, its main source of growth has been in Korea, where people have bought goods at stores, like coffee, using the Chai payment app that’s built on Terra’s blockchain. Kwon said the company’s associated Mirror trading app is experiencing growth in China and Thailand.
Meanwhile, Kwon said Terraform Labs would use its latest $150 million in funding to invest in groups that build financial apps on Terra’s blockchain. He likened the scouting and investing in other groups as akin to a “Y Combinator demo day type of situation,” a reference to the popular startup pitch event organized by early-stage investor Y Combinator.
The combination of all these Terra-specific financial apps shows that Terraform Labs is “almost creating a kind of bank,” said Ryan Watkins, a senior research analyst at cryptocurrency consultancy Messari.
In addition to cryptocurrencies, Terraform Labs has a number of other projects including the Anchor app, a high-yield savings account for holders of the group’s digital coins. Meanwhile, people can use the firm’s associated Mirror app to create synthetic financial assets that mimic more conventional ones, like “tokenized” representations of corporate stocks. These synthetic assets are supposed to be helpful to people like “a small retail trader in Thailand” who can more easily buy shares and “get some exposure to the upside” of stocks that they otherwise wouldn’t have been able to obtain, Kwon said. But some critics have said the U.S. Securities and Exchange Commission may eventually crack down on synthetic stocks, which are currently unregulated.
What do critics say?
Terra still has a long way to go to catch up to bigger cryptocurrency projects like Ethereum.
Most financial transactions involving Terra-related cryptocurrencies have originated in Korea, where its founders are based. Although Terra is becoming more popular in Korea thanks to rising interest in its partner Chai, it’s too early to say whether Terra-related currencies will gain traction in other countries.
Terra’s blockchain runs on a “limited number of nodes,” said Messari’s Watkins, referring to the computers that help keep the system running. That helps reduce latency that may otherwise slow processing of financial transactions, he said.
But the tradeoff is that Terra is less “decentralized” than other blockchain platforms like Ethereum, which is powered by thousands of interconnected computing nodes worldwide. That could make Terra less appealing to some blockchain purists.