


More on Productivity

Jano le Roux
3 years ago
My Top 11 Tools For Building A Modern Startup, With A Free Plan
The best free tools are probably unknown to you.
Modern startups are easy to build.
Start with free tools.
Let’s go.
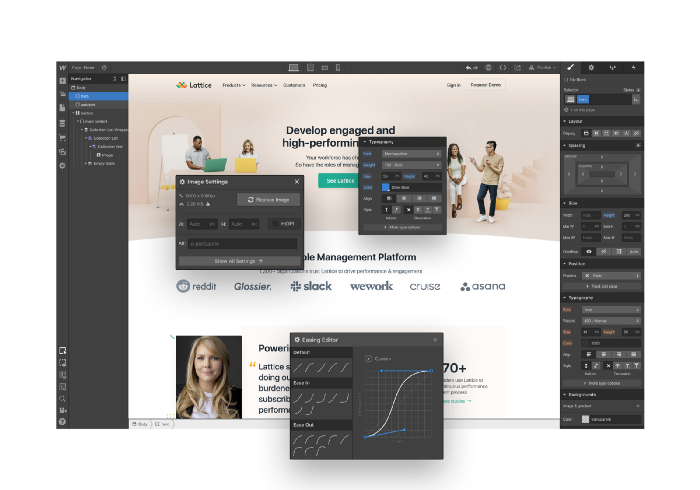
Web development — Webflow
Code-free HTML, CSS, and JS.
Webflow isn't like Squarespace, Wix, or Shopify.
It's a super-fast no-code tool for professionals to construct complex, highly-responsive websites and landing pages.
Webflow can help you add animations like those on Apple's website to your own site.
I made the jump from WordPress a few years ago and it changed my life.
No damn plugins. No damn errors. No damn updates.
The best, you can get started on Webflow for free.
Data tracking — Airtable
Spreadsheet wings.
Airtable combines spreadsheet flexibility with database power without code.
Airtable is modern.
Airtable has modularity.
Scaling Airtable is simple.
Airtable, one of the most adaptable solutions on this list, is perfect for client data management.
Clients choose customized service packages. Airtable consolidates data so you can automate procedures like invoice management and focus on your strengths.
Airtable connects with so many tools that rarely creates headaches. Airtable scales when you do.
Airtable's flexibility makes it a potential backend database.
Design — Figma
Better, faster, easier user interface design.
Figma rocks!
It’s fast.
It's free.
It's adaptable
First, design in Figma.
Iterate.
Export development assets.
Figma lets you add more team members as your company grows to work on each iteration simultaneously.
Figma is web-based, so you don't need a powerful PC or Mac to start.
Task management — Trello
Unclock jobs.
Tacky and terrifying task management products abound. Trello isn’t.
Those that follow Marie Kondo will appreciate Trello.
Everything is clean.
Nothing is complicated.
Everything has a place.
Compared to other task management solutions, Trello is limited. And that’s good. Too many buttons lead to too many decisions lead to too many hours wasted.
Trello is a must for teamwork.
Domain email — Zoho
Free domain email hosting.
Professional email is essential for startups. People relied on monthly payments for too long. Nope.
Zoho offers 5 free professional emails.
It doesn't have Google's UI, but it works.
VPN — Proton VPN
Fast Swiss VPN protects your data and privacy.
Proton VPN is secure.
Proton doesn't record any data.
Proton is based in Switzerland.
Swiss privacy regulation is among the most strict in the world, therefore user data are protected. Switzerland isn't a 14 eye country.
Journalists and activists trust Proton to secure their identities while accessing and sharing information authoritarian governments don't want them to access.
Web host — Netlify
Free fast web hosting.
Netlify is a scalable platform that combines your favorite tools and APIs to develop high-performance sites, stores, and apps through GitHub.
Serverless functions and environment variables preserve API keys.
Netlify's free tier is unmissable.
100GB of free monthly bandwidth.
Free 125k serverless operations per website each month.
Database — MongoDB
Create a fast, scalable database.
MongoDB is for small and large databases. It's a fast and inexpensive database.
Free for the first million reads.
Then, for each million reads, you must pay $0.10.
MongoDB's free plan has:
Encryption from end to end
Continual authentication
field-level client-side encryption
If you have a large database, you can easily connect MongoDB to Webflow to bypass CMS limits.
Automation — Zapier
Time-saving tip: automate repetitive chores.
Zapier simplifies life.
Zapier syncs and connects your favorite apps to do impossibly awesome things.
If your online store is connected to Zapier, a customer's purchase can trigger a number of automated actions, such as:
The customer is being added to an email chain.
Put the information in your Airtable.
Send a pre-programmed postcard to the customer.
Alexa, set the color of your smart lights to purple.
Zapier scales when you do.
Email & SMS marketing — Omnisend
Email and SMS marketing campaigns.
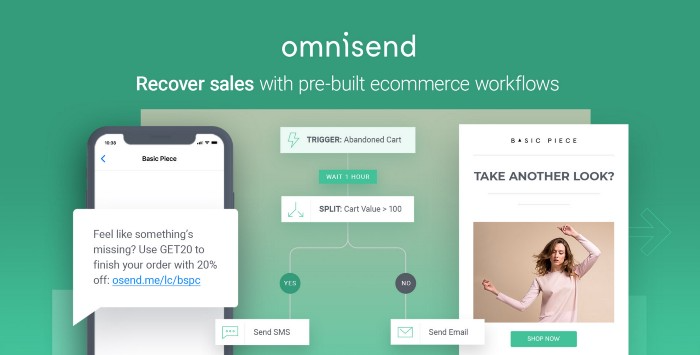
This is an excellent Mailchimp option for magical emails. Omnisend's processes simplify email automation.
I love the interface's cleanliness.
Omnisend's free tier includes web push notifications.
Send up to:
500 emails per month
60 maximum SMSs
500 Web Push Maximum
Forms and surveys — Tally
Create flexible forms that people enjoy.
Typeform is clean but restricting. Sometimes you need to add many questions. Tally's needed sometimes.
Tally is flexible and cheaper than Typeform.
99% of Tally's features are free and unrestricted, including:
Unlimited forms
Countless submissions
Collect payments
File upload
Tally lets you examine what individuals contributed to forms before submitting them to see where they get stuck.
Airtable and Zapier connectors automate things further. If you pay, you can apply custom CSS to fit your brand.
See.
Free tools are the greatest.
Let's use them to launch a startup.

Mickey Mellen
2 years ago
Shifting from Obsidian to Tana?
I relocated my notes database from Roam Research to Obsidian earlier this year expecting to stay there for a long. Obsidian is a terrific tool, and I explained my move in that post.
Moving everything to Tana faster than intended. Tana? Why?
Tana is just another note-taking app, but it does it differently. Three note-taking apps existed before Tana:
simple note-taking programs like Apple Notes and Google Keep.
Roam Research and Obsidian are two graph-style applications that assisted connect your notes.
You can create effective tables and charts with data-focused tools like Notion and Airtable.
Tana is the first great software I've encountered that combines graph and data notes. Google Keep will certainly remain my rapid notes app of preference. This Shu Omi video gives a good overview:
Tana handles everything I did in Obsidian with books, people, and blog entries, plus more. I can find book quotes, log my workouts, and connect my thoughts more easily. It should make writing blog entries notes easier, so we'll see.
Tana is now invite-only, but if you're interested, visit their site and sign up. As Shu noted in the video above, the product hasn't been published yet but seems quite polished.
Whether I stay with Tana or not, I'm excited to see where these apps are going and how they can benefit us all.

Leonardo Castorina
3 years ago
How to Use Obsidian to Boost Research Productivity
Tools for managing your PhD projects, reading lists, notes, and inspiration.
As a researcher, you have to know everything. But knowledge is useless if it cannot be accessed quickly. An easy-to-use method of archiving information makes taking notes effortless and enjoyable.
As a PhD student in Artificial Intelligence, I use Obsidian (https://obsidian.md) to manage my knowledge.
The article has three parts:
- What is a note, how to organize notes, tags, folders, and links? This section is tool-agnostic, so you can use most of these ideas with any note-taking app.
- Instructions for using Obsidian, managing notes, reading lists, and useful plugins. This section demonstrates how I use Obsidian, my preferred knowledge management tool.
- Workflows: How to use Zotero to take notes from papers, manage multiple projects' notes, create MOCs with Dataview, and more. This section explains how to use Obsidian to solve common scientific problems and manage/maintain your knowledge effectively.
This list is not perfect or complete, but it is my current solution to problems I've encountered during my PhD. Please leave additional comments or contact me if you have any feedback. I'll try to update this article.
Throughout the article, I'll refer to your digital library as your "Obsidian Vault" or "Zettelkasten".
Other useful resources are listed at the end of the article.
1. Philosophy: Taking and organizing notes
Carl Sagan: “To make an apple pie from scratch, you must first create the universe.”
Before diving into Obsidian, let's establish a Personal Knowledge Management System and a Zettelkasten. You can skip to Section 2 if you already know these terms.
Niklas Luhmann, a prolific sociologist who wrote 400 papers and 70 books, inspired this section and much of Zettelkasten. Zettelkasten means “slip box” (or library in this article). His Zettlekasten had around 90000 physical notes, which can be found here.
There are now many tools available to help with this process. Obsidian's website has a good introduction section: https://publish.obsidian.md/hub/
Notes
We'll start with "What is a note?" Although it may seem trivial, the answer depends on the topic or your note-taking style. The idea is that a note is as “atomic” (i.e. You should read the note and get the idea right away.
The resolution of your notes depends on their detail. Deep Learning, for example, could be a general description of Neural Networks, with a few notes on the various architectures (eg. Recurrent Neural Networks, Convolutional Neural Networks etc..).
Limiting length and detail is a good rule of thumb. If you need more detail in a specific section of this note, break it up into smaller notes. Deep Learning now has three notes:
- Deep Learning
- Recurrent Neural Networks
- Convolutional Neural Networks
Repeat this step as needed until you achieve the desired granularity. You might want to put these notes in a “Neural Networks” folder because they are all about the same thing. But there's a better way:
#Tags and [[Links]] over /Folders/
The main issue with folders is that they are not flexible and assume that all notes in the folder belong to a single category. This makes it difficult to make connections between topics.
Deep Learning has been used to predict protein structure (AlphaFold) and classify images (ImageNet). Imagine a folder structure like this:
- /Proteins/
- Protein Folding
- /Deep Learning/
- /Proteins/
Your notes about Protein Folding and Convolutional Neural Networks will be separate, and you won't be able to find them in the same folder.
This can be solved in several ways. The most common one is to use tags rather than folders. A note can be grouped with multiple topics this way. Obsidian tags can also be nested (have subtags).
You can also link two notes together. You can build your “Knowledge Graph” in Obsidian and other note-taking apps like Obsidian.
My Knowledge Graph. Green: Biology, Red: Machine Learning, Yellow: Autoencoders, Blue: Graphs, Brown: Tags.
My Knowledge Graph and the note “Backrpropagation” and its links.
Backpropagation note and all its links
Why use Folders?
Folders help organize your vault as it grows. The main suggestion is to have few folders that "weakly" collect groups of notes or better yet, notes from different sources.
Among my Zettelkasten folders are:
My Zettelkasten's 5 folders
They usually gather data from various sources:
MOC: Map of Contents for the Zettelkasten.
Projects: Contains one note for each side-project of my PhD where I log my progress and ideas. Notes are linked to these.
Bio and ML: These two are the main content of my Zettelkasten and could theoretically be combined.
Papers: All my scientific paper notes go here. A bibliography links the notes. Zotero .bib file
Books: I make a note for each book I read, which I then split into multiple notes.
Keeping images separate from other files can help keep your main folders clean.
I will elaborate on these in the Workflow Section.
My general recommendation is to use tags and links instead of folders.
Maps of Content (MOC)
Making Tables of Contents is a good solution (MOCs).
These are notes that "signposts" your Zettelkasten library, directing you to the right type of notes. It can link to other notes based on common tags. This is usually done with a title, then your notes related to that title. As an example:
An example of a Machine Learning MOC generated with Dataview.
As shown above, my Machine Learning MOC begins with the basics. Then it's on to Variational Auto-Encoders. Not only does this save time, but it also saves scrolling through the tag search section.
So I keep MOCs at the top of my library so I can quickly find information and see my library. These MOCs are generated automatically using an Obsidian Plugin called Dataview (https://github.com/blacksmithgu/obsidian-dataview).
Ideally, MOCs could be expanded to include more information about the notes, their status, and what's left to do. In the absence of this, Dataview does a fantastic job at creating a good structure for your notes.
In the absence of this, Dataview does a fantastic job at creating a good structure for your notes.
2. Tools: Knowing Obsidian
Obsidian is my preferred tool because it is free, all notes are stored in Markdown format, and each panel can be dragged and dropped. You can get it here: https://obsidian.md/
Obsidian interface.
Obsidian is highly customizable, so here is my preferred interface:
The theme is customized from https://github.com/colineckert/obsidian-things
Alternatively, each panel can be collapsed, moved, or removed as desired. To open a panel later, click on the vertical "..." (bottom left of the note panel).
My interface is organized as follows:
How my Obsidian Interface is organized.
Folders/Search:
This is where I keep all relevant folders. I usually use the MOC note to navigate, but sometimes I use the search button to find a note.
Tags:
I use nested tags and look into each one to find specific notes to link.
cMenu:
Easy-to-use menu plugin cMenu (https://github.com/chetachiezikeuzor/cMenu-Plugin)
Global Graph:
The global graph shows all your notes (linked and unlinked). Linked notes will appear closer together. Zoom in to read each note's title. It's a bit overwhelming at first, but as your library grows, you get used to the positions and start thinking of new connections between notes.
Local Graph:
Your current note will be shown in relation to other linked notes in your library. When needed, you can quickly jump to another link and back to the current note.
Links:
Finally, an outline panel and the plugin Obsidian Power Search (https://github.com/aviral-batra/obsidian-power-search) allow me to search my vault by highlighting text.
Start using the tool and worry about panel positioning later. I encourage you to find the best use-case for your library.
Plugins
An additional benefit of using Obsidian is the large plugin library. I use several (Calendar, Citations, Dataview, Templater, Admonition):
Obsidian Calendar Plugin: https://github.com/liamcain
It organizes your notes on a calendar. This is ideal for meeting notes or keeping a journal.
Calendar addon from hans/obsidian-citation-plugin
Obsidian Citation Plugin: https://github.com/hans/
Allows you to cite papers from a.bib file. You can also customize your notes (eg. Title, Authors, Abstract etc..)
Plugin citation from hans/obsidian-citation-plugin
Obsidian Dataview: https://github.com/blacksmithgu/
A powerful plugin that allows you to query your library as a database and generate content automatically. See the MOC section for an example.
Allows you to create notes with specific templates like dates, tags, and headings.
Templater. Obsidian Admonition: https://github.com/valentine195/obsidian-admonition
Blocks allow you to organize your notes.
Plugin warning. Obsidian Admonition (valentine195)
There are many more, but this list should get you started.
3. Workflows: Cool stuff
Here are a few of my workflows for using obsidian for scientific research. This is a list of resources I've found useful for my use-cases. I'll outline and describe them briefly so you can skim them quickly.
3.1 Using Templates to Structure Notes
3.2 Free Note Syncing (Laptop, Phone, Tablet)
3.3 Zotero/Mendeley/JabRef -> Obsidian — Managing Reading Lists
3.4 Projects and Lab Books
3.5 Private Encrypted Diary
3.1 Using Templates to Structure Notes
Plugins: Templater and Dataview (optional).
To take effective notes, you must first make adding new notes as easy as possible. Templates can save you time and give your notes a consistent structure. As an example:
An example of a note using a template.
### [[YOUR MOC]]
# Note Title of your note
**Tags**::
**Links**::
The top line links to your knowledge base's Map of Content (MOC) (see previous sections). After the title, I add tags (and a link between the note and the tag) and links to related notes.
To quickly identify all notes that need to be expanded, I add the tag “#todo”. In the “TODO:” section, I list the tasks within the note.
The rest are notes on the topic.
Templater can help you create these templates. For new books, I use the following template:
### [[Books MOC]]
# Title
**Author**::
**Date::
**Tags::
**Links::
A book template example.
Using a simple query, I can hook Dataview to it.
dataview
table author as Author, date as “Date Finished”, tags as “Tags”, grade as “Grade”
from “4. Books”
SORT grade DESCENDING
using Dataview to query templates.
3.2 Free Note Syncing (Laptop, Phone, Tablet)
No plugins used.
One of my favorite features of Obsidian is the library's self-contained and portable format. Your folder contains everything (plugins included).
Ordinary folders and documents are available as well. There is also a “.obsidian” folder. This contains all your plugins and settings, so you can use it on other devices.
So you can use Google Drive, iCloud, or Dropbox for free as long as you sync your folder (note: your folder should be in your Cloud Folder).
For my iOS and macOS work, I prefer iCloud. You can also use the paid service Obsidian Sync.
3.3 Obsidian — Managing Reading Lists and Notes in Zotero/Mendeley/JabRef
Plugins: Quotes (required).
3.3 Zotero/Mendeley/JabRef -> Obsidian — Taking Notes and Managing Reading Lists of Scientific Papers
My preferred reference manager is Zotero, but this workflow should work with any reference manager that produces a .bib file. This file is exported to my cloud folder so I can access it from any platform.
My Zotero library is tagged as follows:
My reference manager's tags
For readings, I usually search for the tags “!!!” and “To-Read” and select a paper. Annotate the paper next (either on PDF using GoodNotes or on physical paper).
Then I make a paper page using a template in the Citations plugin settings:
An example of my citations template.
Create a new note, open the command list with CMD/CTRL + P, and find the Citations “Insert literature note content in the current pane” to see this lovely view.
Citation generated by the article https://doi.org/10.1101/2022.01.24.22269144
You can then convert your notes to digital. I found that transcribing helped me retain information better.
3.4 Projects and Lab Books
Plugins: Tweaker (required).
PhD students offering advice on thesis writing are common (read as regret). I started asking them what they would have done differently or earlier.
“Deep stuff Leo,” one person said. So my main issue is basic organization, losing track of my tasks and the reasons for them.
As a result, I'd go on other experiments that didn't make sense, and have to reverse engineer my logic for thesis writing. - PhD student now wise Postdoc
Time management requires planning. Keeping track of multiple projects and lab books is difficult during a PhD. How I deal with it:
- One folder for all my projects
- One file for each project
I use a template to create each project
### [[Projects MOC]]
# <% tp.file.title %>
**Tags**::
**Links**::
**URL**::
**Project Description**::## Notes:
### <% tp.file.last_modified_date(“dddd Do MMMM YYYY”) %>
#### Done:
#### TODO:
#### Notes
You can insert a template into a new note with CMD + P and looking for the Templater option.
I then keep adding new days with another template:
### <% tp.file.last_modified_date("dddd Do MMMM YYYY") %>
#### Done:
#### TODO:
#### Notes:
This way you can keep adding days to your project and update with reasonings and things you still have to do and have done. An example below:
Example of project note with timestamped notes.
3.5 Private Encrypted Diary
This is one of my favorite Obsidian uses.
Mini Diary's interface has long frustrated me. After the author archived the project, I looked for a replacement. I had two demands:
- It had to be private, and nobody had to be able to read the entries.
- Cloud syncing was required for editing on multiple devices.
Then I learned about encrypting the Obsidian folder. Then decrypt and open the folder with Obsidian. Sync the folder as usual.
Use CryptoMator (https://cryptomator.org/). Create an encrypted folder in Cryptomator for your Obsidian vault, set a password, and let it do the rest.
If you need a step-by-step video guide, here it is:
Conclusion
So, I hope this was helpful!
In the first section of the article, we discussed notes and note-taking techniques. We discussed when to use tags and links over folders and when to break up larger notes.
Then we learned about Obsidian, its interface, and some useful plugins like Citations for citing papers and Templater for creating note templates.
Finally, we discussed workflows and how to use Zotero to take notes from scientific papers, as well as managing Lab Books and Private Encrypted Diaries.
Thanks for reading and commenting :)
Read original post here
You might also like

Solomon Ayanlakin
3 years ago
Metrics for product management and being a good leader
Never design a product without explicit metrics and tracking tools.
Imagine driving cross-country without a dashboard. How do you know your school zone speed? Low gas? Without a dashboard, you can't monitor your car. You can't improve what you don't measure, as Peter Drucker said. Product managers must constantly enhance their understanding of their users, how they use their product, and how to improve it for optimum value. Customers will only pay if they consistently acquire value from your product.
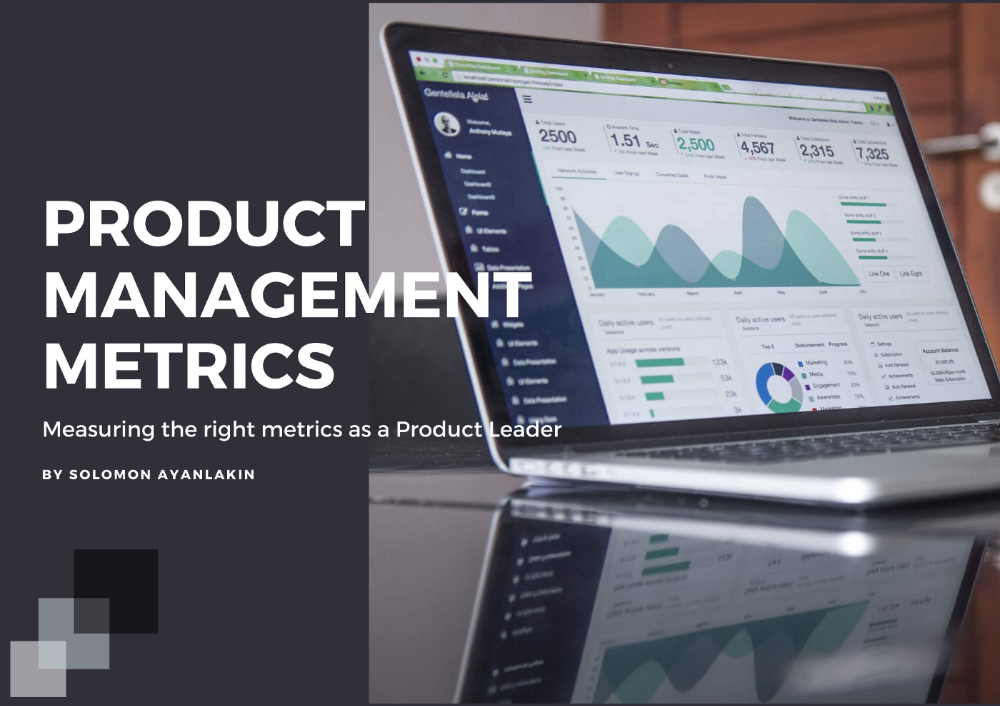
I’m Solomon Ayanlakin. I’m a product manager at CredPal, a financial business that offers credit cards and Buy Now Pay Later services. Before falling into product management (like most PMs lol), I self-trained as a data analyst, using Alex the Analyst's YouTube playlists and DannyMas' virtual data internship. This article aims to help product managers, owners, and CXOs understand product metrics, give a methodology for creating them, and execute product experiments to enhance them.
☝🏽Introduction
Product metrics assist companies track product performance from the user's perspective. Metrics help firms decide what to construct (feature priority), how to build it, and the outcome's success or failure. To give the best value to new and existing users, track product metrics.
Why should a product manager monitor metrics?
to assist your users in having a "aha" moment
To inform you of which features are frequently used by users and which are not
To assess the effectiveness of a product feature
To aid in enhancing client onboarding and retention
To assist you in identifying areas throughout the user journey where customers are satisfied or dissatisfied
to determine the percentage of returning users and determine the reasons for their return
📈 What Metrics Ought a Product Manager to Monitor?
What indicators should a product manager watch to monitor product health? The metrics to follow change based on the industry, business stage (early, growth, late), consumer needs, and company goals. A startup should focus more on conversion, activation, and active user engagement than revenue growth and retention. The company hasn't found product-market fit or discovered what features drive customer value.
Depending on your use case, company goals, or business stage, here are some important product metric buckets:
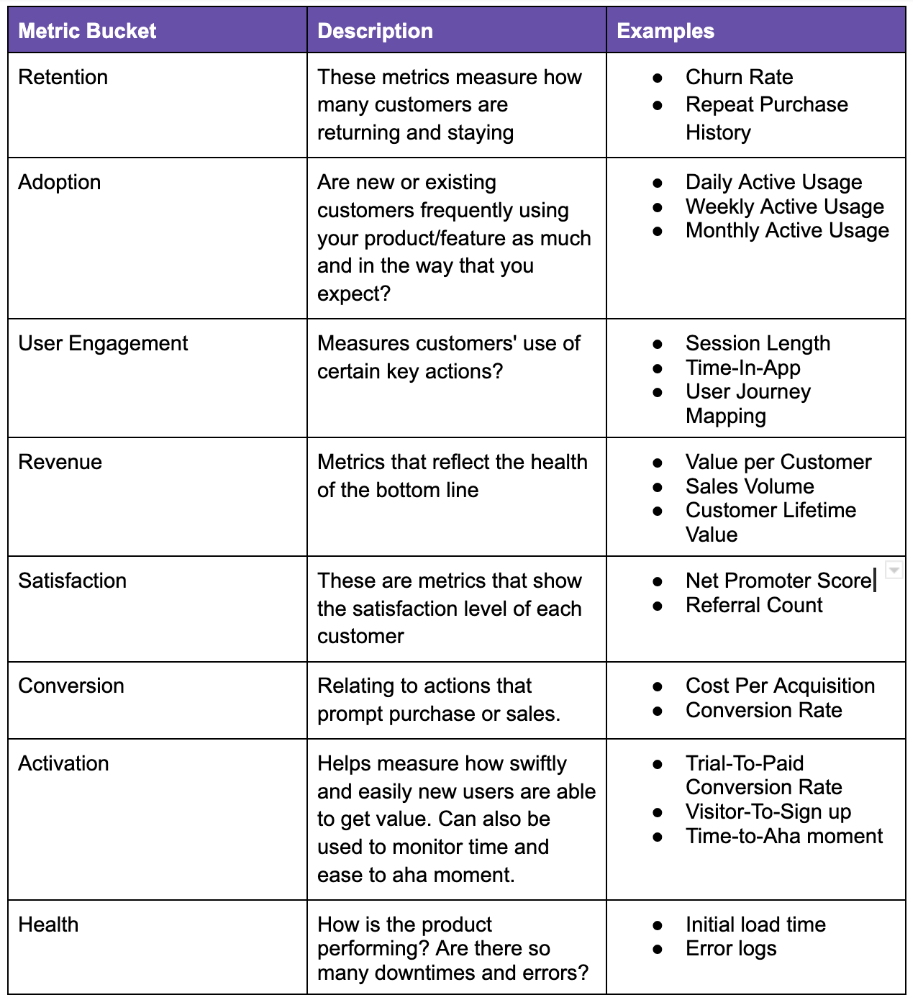
All measurements shouldn't be used simultaneously. It depends on your business goals and what value means for your users, then selecting what metrics to track to see if they get it.
Some KPIs are more beneficial to track, independent of industry or customer type. To prevent recording vanity metrics, product managers must clearly specify the types of metrics they should track. Here's how to segment metrics:
The North Star Metric, also known as the Focus Metric, is the indicator and aid in keeping track of the top value you provide to users.
Primary/Level 1 Metrics: These metrics should either add to the north star metric or be used to determine whether it is moving in the appropriate direction. They are metrics that support the north star metric.
These measures serve as leading indications for your north star and Level 2 metrics. You ought to have been aware of certain problems with your L2 measurements prior to the North star metric modifications.
North Star Metric
This is the key metric. A good north star metric measures customer value. It emphasizes your product's longevity. Many organizations fail to grow because they confuse north star measures with other indicators. A good focus metric should touch all company teams and be tracked forever. If a company gives its customers outstanding value, growth and success are inevitable. How do we measure this value?
A north star metric has these benefits:
Customer Obsession: It promotes a culture of customer value throughout the entire organization.
Consensus: Everyone can quickly understand where the business is at and can promptly make improvements, according to consensus.
Growth: It provides a tool to measure the company's long-term success. Do you think your company will last for a long time?
How can I pick a reliable North Star Metric?
Some fear a single metric. Ensure product leaders can objectively determine a north star metric. Your company's focus metric should meet certain conditions. Here are a few:
A good focus metric should reflect value and, as such, should be closely related to the point at which customers obtain the desired value from your product. For instance, the quick delivery to your home is a value proposition of UberEats. The value received from a delivery would be a suitable focal metric to use. While counting orders is alluring, the quantity of successfully completed positive review orders would make a superior north star statistic. This is due to the fact that a client who placed an order but received a defective or erratic delivery is not benefiting from Uber Eats. By tracking core value gain, which is the number of purchases that resulted in satisfied customers, we are able to track not only the total number of orders placed during a specific time period but also the core value proposition.
Focus metrics need to be quantifiable; they shouldn't only be feelings or states; they need to be actionable. A smart place to start is by counting how many times an activity has been completed.
A great focus metric is one that can be measured within predetermined time limits; otherwise, you are not measuring at all. The company can improve that measure more quickly by having time-bound focus metrics. Measuring and accounting for progress over set time periods is the only method to determine whether or not you are moving in the right path. You can then evaluate your metrics for today and yesterday. It's generally not a good idea to use a year as a time frame. Ideally, depending on the nature of your organization and the measure you are focusing on, you want to take into account on a daily, weekly, or monthly basis.
Everyone in the firm has the potential to affect it: A short glance at the well-known AAARRR funnel, also known as the Pirate Metrics, reveals that various teams inside the organization have an impact on the funnel. Ideally, the NSM should be impacted if changes are made to one portion of the funnel. Consider how the growth team in your firm is enhancing customer retention. This would have a good effect on the north star indicator because at this stage, a repeat client is probably being satisfied on a regular basis. Additionally, if the opposite were true and a client churned, it would have a negative effect on the focus metric.
It ought to be connected to the business's long-term success: The direction of sustainability would be indicated by a good north star metric. A company's lifeblood is product demand and revenue, so it's critical that your NSM points in the direction of sustainability. If UberEats can effectively increase the monthly total of happy client orders, it will remain in operation indefinitely.
Many product teams make the mistake of focusing on revenue. When the bottom line is emphasized, a company's goal moves from giving value to extracting money from customers. A happy consumer will stay and pay for your service. Customer lifetime value always exceeds initial daily, monthly, or weekly revenue.
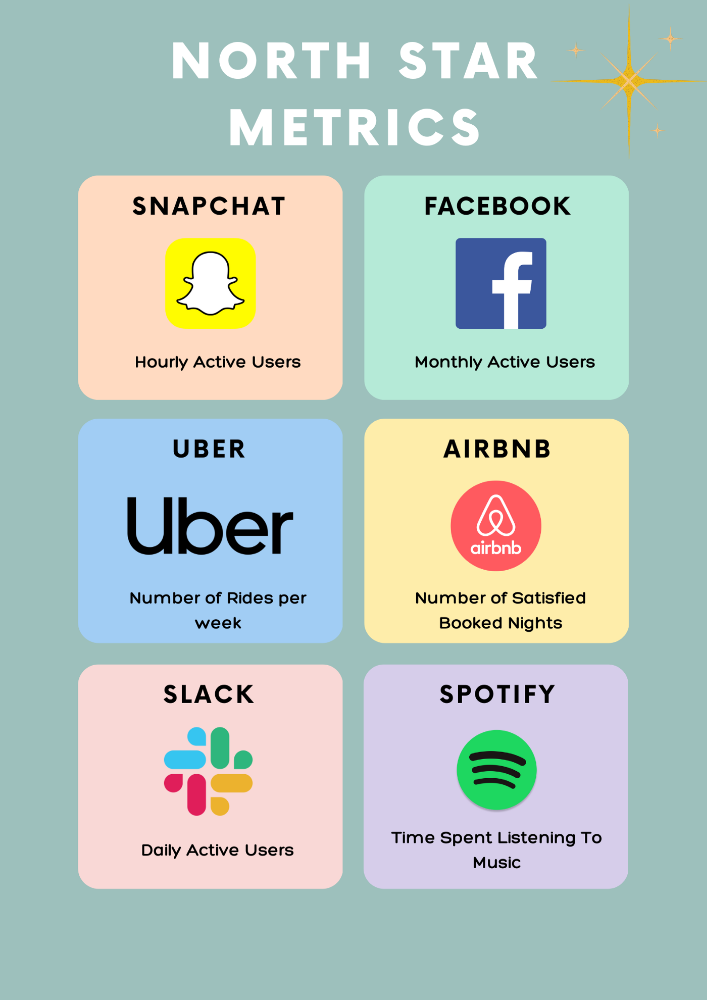
Great North Star Metrics Examples
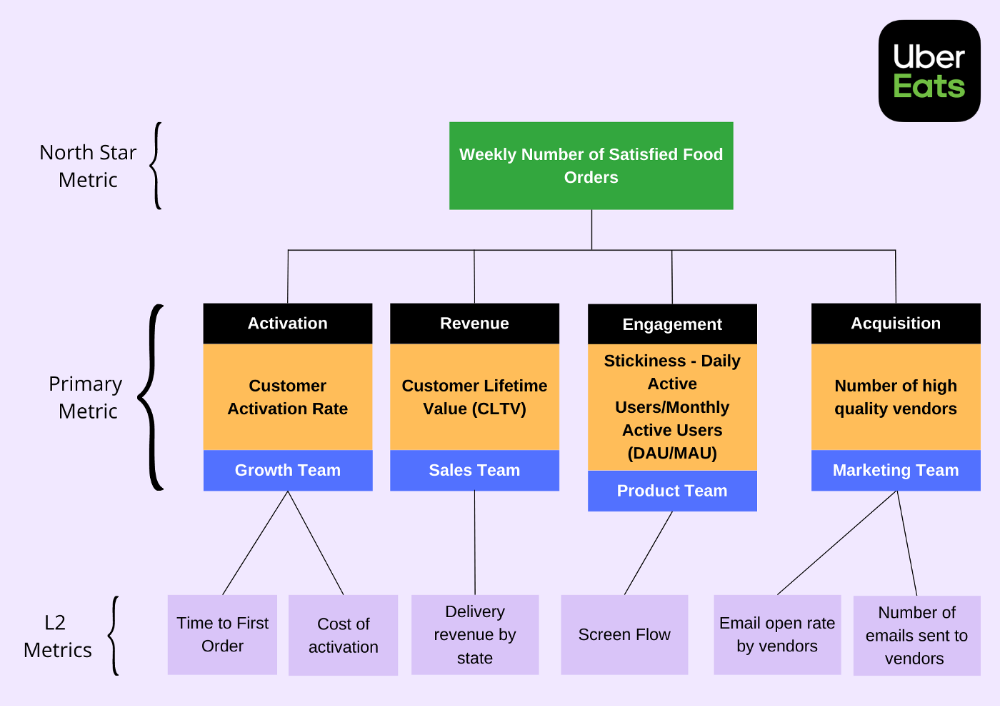
🥇 Basic/L1 Metrics:
The NSM is broad and focuses on providing value for users, while the primary metric is product/feature focused and utilized to drive the focus metric or signal its health. The primary statistic is team-specific, whereas the north star metric is company-wide. For UberEats' NSM, the marketing team may measure the amount of quality food vendors who sign up using email marketing. With quality vendors, more orders will be satisfied. Shorter feedback loops and unambiguous team assignments make L1 metrics more actionable and significant in the immediate term.
🥈 Supporting L2 metrics:
These are supporting metrics to the L1 and focus metrics. Location, demographics, or features are examples of L1 metrics. UberEats' supporting metrics might be the number of sales emails sent to food vendors, the number of opens, and the click-through rate. Secondary metrics are low-level and evident, and they relate into primary and north star measurements. UberEats needs a high email open rate to attract high-quality food vendors. L2 is a leading sign for L1.
Where can I find product metrics?
How can I measure in-app usage and activity now that I know what metrics to track? Enter product analytics. Product analytics tools evaluate and improve product management parameters that indicate a product's health from a user's perspective.
Various analytics tools on the market supply product insight. From page views and user flows through A/B testing, in-app walkthroughs, and surveys. Depending on your use case and necessity, you may combine tools to see how users engage with your product. Gainsight, MixPanel, Amplitude, Google Analytics, FullStory, Heap, and Pendo are product tools.
This article isn't sponsored and doesn't market product analytics tools. When choosing an analytics tool, consider the following:
Tools for tracking your Focus, L1, and L2 measurements
Pricing
Adaptations to include external data sources and other products
Usability and the interface
Scalability
Security
An investment in the appropriate tool pays off. To choose the correct metrics to track, you must first understand your business need and what value means to your users. Metrics and analytics are crucial for any tech product's growth. It shows how your business is doing and how to best serve users.

Jayden Levitt
3 years ago
The country of El Salvador's Bitcoin-obsessed president lost $61.6 million.
It’s only a loss if you sell, right?

Nayib Bukele proclaimed himself “the world’s coolest dictator”.
His jokes aren't clear.
El Salvador's 43rd president self-proclaimed “CEO of El Salvador” couldn't be less presidential.
His thin jeans, aviator sunglasses, and baseball caps like a cartel lord.
He's popular, though.
Bukele won 53% of the vote by fighting violent crime and opposition party corruption.
El Salvador's 6.4 million inhabitants are riding the cryptocurrency volatility wave.
They were powerless.
Their autocratic leader, a former Yamaha Motors salesperson and Bitcoin believer, wants to help 70% unbanked locals.
He intended to give the citizens a way to save money and cut the country's $200 million remittance cost.
Transfer and deposit costs.
This makes logical sense when the president’s theatrics don’t blind you.
El Salvador's Bukele revealed plans to make bitcoin legal tender.
Remittances total $5.9 billion (23%) of the country's expenses.
Anything that reduces costs could boost the economy.
The country’s unbanked population is staggering. Here’s the data by % of people who either have a bank account (Blue) or a mobile money account (Black).
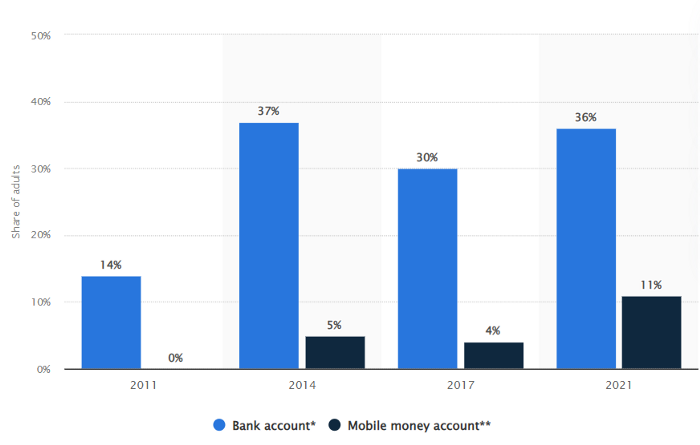
According to Bukele, 46% of the population has downloaded the Chivo Bitcoin Wallet.
In 2021, 36% of El Salvadorans had bank accounts.
Large rural countries like Kenya seem to have resolved their unbanked dilemma.
An economy surfaced where village locals would sell, trade and store network minutes and data as a store of value.
Kenyan phone networks realized unbanked people needed a safe way to accumulate wealth and have an emergency fund.
96% of Kenyans utilize M-PESA, which doesn't require a bank account.
The software involves human agents who hang out with cash and a phone.
These people are like ATMs.
You offer them cash to deposit money in your mobile money account or withdraw cash.
In a country with a faulty banking system, cash availability and a safe place to deposit it are important.
William Jack and Tavneet Suri found that M-PESA brought 194,000 Kenyan households out of poverty by making transactions cheaper and creating a safe store of value.
Mobile money, a service that allows monetary value to be stored on a mobile phone and sent to other users via text messages, has been adopted by most Kenyan households. We estimate that access to the Kenyan mobile money system M-PESA increased per capita consumption levels and lifted 194,000 households, or 2% of Kenyan households, out of poverty.
The impacts, which are more pronounced for female-headed households, appear to be driven by changes in financial behaviour — in particular, increased financial resilience and saving. Mobile money has therefore increased the efficiency of the allocation of consumption over time while allowing a more efficient allocation of labour, resulting in a meaningful reduction of poverty in Kenya.
Currently, El Salvador has 2,301 Bitcoin.
At publication, it's worth $44 million. That remains 41% of Bukele's original $105.6 million.
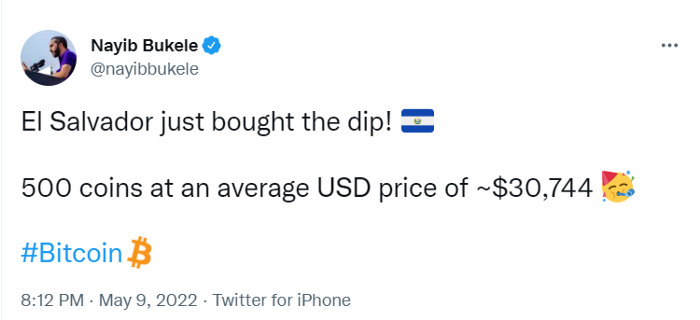
Unknown if the country has sold Bitcoin, but Bukeles keeps purchasing the dip.
It's still falling.
This might be a fantastic move for the impoverished country over the next five years, if they can live economically till Bitcoin's price recovers.
The evidence demonstrates that a store of value pulls individuals out of poverty, but others say Bitcoin is premature.
You may regard it as an aggressive endeavor to front run the next wave of adoption, offering El Salvador a financial upside.

DC Palter
2 years ago
Why Are There So Few Startups in Japan?
Japan's startup challenge: 7 reasons

Every day, another Silicon Valley business is bought for a billion dollars, making its founders rich while growing the economy and improving consumers' lives.
Google, Amazon, Twitter, and Medium dominate our daily lives. Tesla automobiles and Moderna Covid vaccinations.
The startup movement started in Silicon Valley, California, but the rest of the world is catching up. Global startup buzz is rising. Except Japan.
644 of CB Insights' 1170 unicorns—successful firms valued at over $1 billion—are US-based. China follows with 302 and India third with 108.
Japan? 6!
1% of US startups succeed. The third-largest economy is tied with small Switzerland for startup success.
Mexico (8), Indonesia (12), and Brazil (12) have more successful startups than Japan (16). South Korea has 16. Yikes! Problem?
Why Don't Startups Exist in Japan More?
Not about money. Japanese firms invest in startups. To invest in startups, big Japanese firms create Silicon Valley offices instead of Tokyo.
Startups aren't the issue either. Local governments are competing to be Japan's Shirikon Tani, providing entrepreneurs financing, office space, and founder visas.
Startup accelerators like Plug and Play in Tokyo, Osaka, and Kyoto, the Startup Hub in Kobe, and Google for Startups are many.
Most of the companies I've encountered in Japan are either local offices of foreign firms aiming to expand into the Japanese market or small businesses offering local services rather than disrupting a staid industry with new ideas.
There must be a reason Japan can develop world-beating giant corporations like Toyota, Nintendo, Shiseido, and Suntory but not inventive startups.
Culture, obviously. Japanese culture excels in teamwork, craftsmanship, and quality, but it hates moving fast, making mistakes, and breaking things.
If you have a brilliant idea in Silicon Valley, quit your job, get money from friends and family, and build a prototype. To fund the business, you approach angel investors and VCs.
Most non-startup folks don't aware that venture capitalists don't want good, profitable enterprises. That's wonderful if you're developing a solid small business to consult, open shops, or make a specialty product. However, you must pay for it or borrow money. Venture capitalists want moon rockets. Silicon Valley is big or bust. Almost 90% will explode and crash. The few successes are remarkable enough to make up for the failures.
Silicon Valley's high-risk, high-reward attitude contrasts with Japan's incrementalism. Japan makes the best automobiles and cleanrooms, but it fails to produce new items that grow the economy.
Changeable? Absolutely. But, what makes huge manufacturing enterprises successful and what makes Japan a safe and comfortable place to live are inextricably connected with the lack of startups.
Barriers to Startup Development in Japan
These are the 7 biggest obstacles to Japanese startup success.
Unresponsive Employment Market
While the lifelong employment system in Japan is evolving, the average employee stays at their firm for 12 years (15 years for men at large organizations) compared to 4.3 years in the US. Seniority, not experience or aptitude, determines career routes, making it tough to quit a job to join a startup and then return to corporate work if it fails.
Conservative Buyers
Even if your product is buggy and undocumented, US customers will migrate to a cheaper, superior one. Japanese corporations demand perfection from their trusted suppliers and keep with them forever. Startups need income fast, yet product evaluation takes forever.
Failure intolerance
Japanese business failures harm lives. Failed forever. It hinders risk-taking. Silicon Valley embraces failure. Build another startup if your first fails. Build a third if that fails. Every setback is viewed as a learning opportunity for success.
4. No Corporate Purchases
Silicon Valley industrial giants will buy fast-growing startups for a lot of money. Many huge firms have stopped developing new goods and instead buy startups after the product is validated.
Japanese companies prefer in-house product development over startup acquisitions. No acquisitions mean no startup investment and no investor reward.
Startup investments can also be monetized through stock market listings. Public stock listings in Japan are risky because the Nikkei was stagnant for 35 years while the S&P rose 14x.
5. Social Unity Above Wealth
In Silicon Valley, everyone wants to be rich. That creates a competitive environment where everyone wants to succeed, but it also promotes fraud and societal problems.
Japan values communal harmony above individual success. Wealthy folks and overachievers are avoided. In Japan, renegades are nearly impossible.
6. Rote Learning Education System
Japanese high school graduates outperform most Americans. Nonetheless, Japanese education is known for its rote memorization. The American system, which fails too many kids, emphasizes creativity to create new products.
Immigration.
Immigrants start 55% of successful Silicon Valley firms. Some come for university, some to escape poverty and war, and some are recruited by Silicon Valley startups and stay to start their own.
Japan is difficult for immigrants to start a business due to language barriers, visa restrictions, and social isolation.
How Japan Can Promote Innovation
Patchwork solutions to deep-rooted cultural issues will not work. If customers don't buy things, immigration visas won't aid startups. Startups must have a chance of being acquired for a huge sum to attract investors. If risky startups fail, employees won't join.
Will Japan never have a startup culture?
Once a consensus is reached, Japan changes rapidly. A dwindling population and standard of living may lead to such consensus.
Toyota and Sony were firms with renowned founders who used technology to transform the world. Repeatable.
Silicon Valley is flawed too. Many people struggle due to wealth disparities, job churn and layoffs, and the tremendous ups and downs of the economy caused by stock market fluctuations.
The founders of the 10% successful startups are heroes. The 90% that fail and return to good-paying jobs with benefits are never mentioned.
Silicon Valley startup culture and Japanese corporate culture are opposites. Each have pros and cons. Big Japanese corporations make the most reliable, dependable, high-quality products yet move too slowly. That's good for creating cars, not social networking apps.
Can innovation and success be encouraged without eroding social cohesion? That can motivate software firms to move fast and break things while recognizing the beauty and precision of expert craftsmen? A hybrid culture where Japan can make the world's best and most original items. Hopefully.