


Investors can bet big on almost anything on a new prediction market.
Kalshi allows five-figure bets on the Grammys, the next Covid wave, and future SEC commissioners. Worst-case scenario
On Election Day 2020, two young entrepreneurs received a call from the CFTC chairman. Luana Lopes Lara and Tarek Mansour spent 18 months trying to start a new type of financial exchange. Instead of betting on stock prices or commodity futures, people could trade instruments tied to real-world events, such as legislation, the weather, or the Oscar winner.
Heath Tarbert, a Trump appointee, shouted "Congratulations." "You're competing with 1840s-era markets. I'm sure you'll become a powerhouse too."
Companies had tried to introduce similar event markets in the US for years, but Tarbert's agency, the CFTC, said no, arguing they were gambling and prone to cheating. Now the agency has reversed course, approving two 24-year-olds who will have first-mover advantage in what could become a huge new asset class. Kalshi Inc. raised $30 million from venture capitalists within weeks of Tarbert's call, his representative says. Mansour, 26, believes this will be bigger than crypto.
Anyone who's read The Wisdom of Crowds knows prediction markets' potential. Well-designed markets can help draw out knowledge from disparate groups, and research shows that when money is at stake, people make better predictions. Lopes Lara calls it a "bullshit tax." That's why Google, Microsoft, and even the US Department of Defense use prediction markets internally to guide decisions, and why university-linked political betting sites like PredictIt sometimes outperform polls.
Regulators feared Wall Street-scale trading would encourage investors to manipulate reality. If the stakes are high enough, traders could pressure congressional staffers to stall a bill or bet on whether Kanye West's new album will drop this week. When Lopes Lara and Mansour pitched the CFTC, senior regulators raised these issues. Politically appointed commissioners overruled their concerns, and one later joined Kalshi's board.
Will Kanye’s new album come out next week? Yes or no?
Kalshi's victory was due more to lobbying and legal wrangling than to Silicon Valley-style innovation. Lopes Lara and Mansour didn't invent anything; they changed a well-established concept's governance. The result could usher in a new era of market-based enlightenment or push Wall Street's destructive tendencies into the real world.
If Kalshi's founders lacked experience to bolster their CFTC application, they had comical youth success. Lopes Lara studied ballet at the Brazilian Bolshoi before coming to the US. Mansour won France's math Olympiad. They bonded over their work ethic in an MIT computer science class.
Lopes Lara had the idea for Kalshi while interning at a New York hedge fund. When the traders around her weren't working, she noticed they were betting on the news: Would Apple hit a trillion dollars? Kylie Jenner? "It was anything," she says.
Are mortgage rates going up? Yes or no?
Mansour saw the business potential when Lopes Lara suggested it. He interned at Goldman Sachs Group Inc., helping investors prepare for the UK leaving the EU. Goldman sold clients complex stock-and-derivative combinations. As he discussed it with Lopes Lara, they agreed that investors should hedge their risk by betting on Brexit itself rather than an imperfect proxy.
Lopes Lara and Mansour hypothesized how a marketplace might work. They settled on a "event contract," a binary-outcome instrument like "Will inflation hit 5% by the end of the month?" The contract would settle at $1 (if the event happened) or zero (if it didn't), but its price would fluctuate based on market sentiment. After a good debate, a politician's election odds may rise from 50 to 55. Kalshi would charge a commission on every trade and sell data to traders, political campaigns, businesses, and others.
In October 2018, five months after graduation, the pair flew to California to compete in a hackathon for wannabe tech founders organized by the Silicon Valley incubator Y Combinator. They built a website in a day and a night and presented it to entrepreneurs the next day. Their prototype barely worked, but they won a three-month mentorship program and $150,000. Michael Seibel, managing director of Y Combinator, said of their idea, "I had to take a chance!"
Will there be another moon landing by 2025?
Seibel's skepticism was rooted in America's historical wariness of gambling. Roulette, poker, and other online casino games are largely illegal, and sports betting was only legal in a few states until May 2018. Kalshi as a risk-hedging platform rather than a bookmaker seemed like a good idea, but convincing the CFTC wouldn't be easy. In 2012, the CFTC said trading on politics had no "economic purpose" and was "contrary to the public interest."
Lopes Lara and Mansour cold-called 60 Googled lawyers during their time at Y Combinator. Everyone advised quitting. Mansour recalls the pain. Jeff Bandman, a former CFTC official, helped them navigate the agency and its characters.
When they weren’t busy trying to recruit lawyers, Lopes Lara and Mansour were meeting early-stage investors. Alfred Lin of Sequoia Capital Operations LLC backed Airbnb, DoorDash, and Uber Technologies. Lin told the founders their idea could capitalize on retail trading and challenge how the financial world manages risk. "Come back with regulatory approval," he said.
In the US, even small bets on most events were once illegal. Under the Commodity Exchange Act, the CFTC can stop exchanges from listing contracts relating to "terrorism, assassination, war" and "gaming" if they are "contrary to the public interest," which was often the case.
Will subway ridership return to normal? Yes or no?
In 1988, as academic interest in the field grew, the agency allowed the University of Iowa to set up a prediction market for research purposes, as long as it didn't make a profit or advertise and limited bets to $500. PredictIt, the biggest and best-known political betting platform in the US, also got an exemption thanks to an association with Victoria University of Wellington in New Zealand. Today, it's a sprawling marketplace with its own subculture and lingo. PredictIt users call it "Rules Cuck Panther" when they lose on a technicality. Major news outlets cite PredictIt's odds on Discord and the Star Spangled Gamblers podcast.
CFTC limits PredictIt bets to $850. To keep traders happy, PredictIt will often run multiple variations of the same question, listing separate contracts for two dozen Democratic primary candidates, for example. A trader could have more than $10,000 riding on a single outcome. Some of the site's traders are current or former campaign staffers who can answer questions like "How many tweets will Donald Trump post from Nov. 20 to 27?" and "When will Anthony Scaramucci's role as White House communications director end?"
According to PredictIt co-founder John Phillips, politicians help explain the site's accuracy. "Prediction markets work well and are accurate because they attract people with superior information," he said in a 2016 podcast. “In the financial stock market, it’s called inside information.”
Will Build Back Better pass? Yes or no?
Trading on nonpublic information is illegal outside of academia, which presented a dilemma for Lopes Lara and Mansour. Kalshi's forecasts needed to be accurate. Kalshi must eliminate insider trading as a regulated entity. Lopes Lara and Mansour wanted to build a high-stakes PredictIt without the anarchy or blurred legal lines—a "New York Stock Exchange for Events." First, they had to convince regulators event trading was safe.
When Lopes Lara and Mansour approached the CFTC in the spring of 2019, some officials in the Division of Market Oversight were skeptical, according to interviews with people involved in the process. For all Kalshi's talk of revolutionizing finance, this was just a turbocharged version of something that had been rejected before.
The DMO couldn't see the big picture. The staff review was supposed to ensure Kalshi could complete a checklist, "23 Core Principles of a Designated Contract Market," which included keeping good records and having enough money. The five commissioners decide. With Trump as president, three of them were ideologically pro-market.
Lopes Lara, Mansour, and their lawyer Bandman, an ex-CFTC official, answered the DMO's questions while lobbying the commissioners on Zoom about the potential of event markets to mitigate risks and make better decisions. Before each meeting, they would write a script and memorize it word for word.
Will student debt be forgiven? Yes or no?
Several prediction markets that hadn't sought regulatory approval bolstered Kalshi's case. Polymarket let customers bet hundreds of thousands of dollars anonymously using cryptocurrencies, making it hard to track. Augur, which facilitates private wagers between parties using blockchain, couldn't regulate bets and hadn't stopped users from betting on assassinations. Kalshi, by comparison, argued it was doing everything right. (The CFTC fined Polymarket $1.4 million for operating an unlicensed exchange in January 2022. Polymarket says it's now compliant and excited to pioneer smart contract-based financial solutions with regulators.
Kalshi was approved unanimously despite some DMO members' concerns about event contracts' riskiness. "Once they check all the boxes, they're in," says a CFTC insider.
Three months after CFTC approval, Kalshi announced funding from Sequoia, Charles Schwab, and Henry Kravis. Sequoia's Lin, who joined the board, said Tarek, Luana, and team created a new way to invest and engage with the world.
The CFTC hadn't asked what markets the exchange planned to run since. After approval, Lopes Lara and Mansour had the momentum. Kalshi's March list of 30 proposed contracts caused chaos at the DMO. The division handles exchanges that create two or three new markets a year. Kalshi’s business model called for new ones practically every day.
Uncontroversial proposals included weather and GDP questions. Others, on the initial list and later, were concerning. DMO officials feared Covid-19 contracts amounted to gambling on human suffering, which is why war and terrorism markets are banned. (Similar logic doomed ex-admiral John Poindexter's Policy Analysis Market, a Bush-era plan to uncover intelligence by having security analysts bet on Middle East events.) Regulators didn't see how predicting the Grammy winners was different from betting on the Patriots to win the Super Bowl. Who, other than John Legend, would need to hedge the best R&B album winner?
Event contracts raised new questions for the DMO's product review team. Regulators could block gaming contracts that weren't in the public interest under the Commodity Exchange Act, but no one had defined gaming. It was unclear whether the CFTC had a right or an obligation to consider whether a contract was in the public interest. How was it to determine public interest? Another person familiar with the CFTC review says, "It was a mess." The agency didn't comment.
CFTC staff feared some event contracts could be cheated. Kalshi wanted to run a bee-endangerment market. The DMO pushed back, saying it saw two problems symptomatic of the asset class: traders could press government officials for information, and officials could delay adding the insects to the list to cash in.
The idea that traders might manipulate prediction markets wasn't paranoid. In 2013, academics David Rothschild and Rajiv Sethi found that an unidentified party lost $7 million buying Mitt Romney contracts on Intrade, a now-defunct, unlicensed Irish platform, in the runup to the 2012 election. The authors speculated that the trader, whom they dubbed the “Romney Whale,” may have been looking to boost morale and keep donations coming in.
Kalshi said manipulation and insider trading are risks for any market. It built a surveillance system and said it would hire a team to monitor it. "People trade on events all the time—they just use options and other instruments. This brings everything into the open, Mansour says. Kalshi didn't include election contracts, a red line for CFTC Democrats.
Lopes Lara and Mansour were ready to launch kalshi.com that summer, but the DMO blocked them. Product reviewers were frustrated by spending half their time on an exchange that represented a tiny portion of the derivatives market. Lopes Lara and Mansour pressed politically appointed commissioners during the impasse.
Tarbert, the chairman, had moved on, but Kalshi found a new supporter in Republican Brian Quintenz, a crypto-loving former hedge fund manager. He was unmoved by the DMO's concerns, arguing that speculation on Kalshi's proposed events was desirable and the agency had no legal standing to prevent it. He supported a failed bid to allow NFL futures earlier this year. Others on the commission were cautious but supportive. Given the law's ambiguity, they worried they'd be on shaky ground if Kalshi sued if they blocked a contract. Without a permanent chairman, the agency lacked leadership.
To block a contract, DMO staff needed a majority of commissioners' support, which they didn't have in all but a few cases. "We didn't have the votes," a reviewer says, paraphrasing Hamilton. By the second half of 2021, new contract requests were arriving almost daily at the DMO, and the demoralized and overrun division eventually accepted defeat and stopped fighting back. By the end of the year, three senior DMO officials had left the agency, making it easier for Kalshi to list its contracts unimpeded.
Today, Kalshi is growing. 32 employees work in a SoHo office with big windows and exposed brick. Quintenz, who left the CFTC 10 months after Kalshi was approved, is on its board. He joined because he was interested in the market's hedging and risk management opportunities.
Mid-May, the company's website had 75 markets, such as "Will Q4 GDP be negative?" Will NASA land on the moon by 2025? The exchange recently reached 2 million weekly contracts, a jump from where it started but still a small number compared to other futures exchanges. Early adopters are PredictIt and Polymarket fans. Bets on the site are currently capped at $25,000, but Kalshi hopes to increase that to $100,000 and beyond.
With the regulatory drawbridge down, Lopes Lara and Mansour must move quickly. Chicago's CME Group Inc. plans to offer index-linked event contracts. Kalshi will release a smartphone app to attract customers. After that, it hopes to partner with a big brokerage. Sequoia is a major investor in Robinhood Markets Inc. Robinhood users could have access to Kalshi so that after buying GameStop Corp. shares, they'd be prompted to bet on the Oscars or the next Fed commissioner.
Some, like Illinois Democrat Sean Casten, accuse Robinhood and its competitors of gamifying trading to encourage addiction, but Kalshi doesn't seem worried. Mansour says Kalshi's customers can't bet more than they've deposited, making debt difficult. Eventually, he may introduce leveraged bets.
Tension over event contracts recalls another CFTC episode. Brooksley Born proposed regulating the financial derivatives market in 1994. Alan Greenspan and others in the government opposed her, saying it would stifle innovation and push capital overseas. Unrestrained, derivatives grew into a trillion-dollar industry until 2008, when they sparked the financial crisis.
Today, with a midterm election looming, it seems reasonable to ask whether Kalshi plans to get involved. Elections have historically been the biggest draw in prediction markets, with 125 million shares traded on PredictIt for 2020. “We can’t discuss specifics,” Mansour says. “All I can say is, you know, we’re always working on expanding the universe of things that people can trade on.”
Any election contracts would need CFTC approval, which may be difficult with three Democratic commissioners. A Republican president would change the equation.
More on Economics & Investing

Cory Doctorow
3 years ago
The current inflation is unique.
New Stiglitz just dropped.
Here's the inflation story everyone believes (warning: it's false): America gave the poor too much money during the recession, and now the economy is awash with free money, which made them so rich they're refusing to work, meaning the economy isn't making anything. Prices are soaring due to increased cash and missing labor.
Lawrence Summers says there's only one answer. We must impoverish the poor: raise interest rates, cause a recession, and eliminate millions of jobs, until the poor are stripped of their underserved fortunes and return to work.
https://pluralistic.net/2021/11/20/quiet-part-out-loud/#profiteering
This is nonsense. Countries around the world suffered inflation during and after lockdowns, whether they gave out humanitarian money to keep people from starvation. America has slightly greater inflation than other OECD countries, but it's not due to big relief packages.
The Causes of and Responses to Today's Inflation, a Roosevelt Institute report by Nobel-winning economist Joseph Stiglitz and macroeconomist Regmi Ira, debunks this bogus inflation story and offers a more credible explanation for inflation.
https://rooseveltinstitute.org/wp-content/uploads/2022/12/RI CausesofandResponsestoTodaysInflation Report 202212.pdf
Sharp interest rate hikes exacerbate the slump and increase inflation, the authors argue. They compare monetary policy inflation cures to medieval bloodletting, where doctors repeated the same treatment until the patient recovered (for which they received credit) or died (which was more likely).
Let's discuss bloodletting. Inflation hawks warn of the wage price spiral, when inflation rises and powerful workers bargain for higher pay, driving up expenses, prices, and wages. This is the fairy-tale narrative of the 1970s, and it's true except that OPEC's embargo drove up oil prices, which produced inflation. Oh well.
Let's be generous to seventies-haunted inflation hawks and say we're worried about a wage-price spiral. Fantastic! No. Real wages are 2.3% lower than they were in Oct 2021 after peaking in June at 4.8%.
Why did America's powerful workers take a paycut rather than demand inflation-based pay? Weak unions, globalization, economic developments.
Workers don't expect inflation to rise, so they're not requesting inflationary hikes. Inflationary expectations have remained moderate, consistent with our data interpretation.
https://www.newyorkfed.org/microeconomics/sce#/
Neither are workers. Working people see surplus savings as wealth and spend it gradually over their lives, despite rising demand. People may have saved money by staying in during the lockdown, but they don't eat out every night to make up for it. Instead, they keep those savings as precautionary balances. This is why the economy is lagging.
People don't buy non-traded goods with pandemic savings (basically, imports). Imports don't multiply like domestic purchases. If you buy a loaf of bread from the corner baker for $1 and they spend it at the tavern across the street, that dollar generates $3 in economic activity. Spending a dollar on foreign goods leaves the country and any multiplier effect happens there, not in the US.
Only marginally higher wages. The ECI is up 1.6% from 2019. Almost all gains went to the 25% lowest-paid Americans. Contrary to the inflation worry about too much savings, these workers don't make enough to save, even post-pandemic.
Recreation and transit spending are at or below pre-pandemic levels. Higher food and hotel prices (which doesn’t mean we’re buying more food than we were in 2019, just that it costs more).
What causes inflation if not greedy workers, free money, and high demand? The most expensive domestic goods produce the biggest revenues for their manufacturers. They charge you more without paying their workers or suppliers more.
The largest price-gougers are funneling their earnings to rich people who store it offshore through stock buybacks and dividends. A $1 billion stock buyback doesn't buy $1 billion in bread.
Five factors influence US inflation today:
I. Price rises for energy and food
II. shifts in consumer tastes
III. supply interruptions (mainly autos);
IV. increased rents (due to telecommuting);
V. monopoly (AKA price-gouging).
None can be remedied by raising interest rates or laying off workers.
Russia's invasion of Ukraine, omicron, and China's Zero Covid policy all disrupted the flow of food, energy, and production inputs. The price went higher because we made less.
After Russia invaded Ukraine, oil prices spiked, and sanctions made it worse. But that was February. By October, oil prices had returned to pre-pandemic, 2015 levels attributable to global economic adjustments, including a shift to renewables. Every new renewable installation reduces oil consumption and affects oil prices.
High food prices have a simple solution. The US and EU have bribed farmers not to produce for 50 years. If the war continues, this program may end, and food prices may decline.
Demand changes. We want different things than in 2019, not more. During the lockdown, people substituted goods. Half of the US toilet-paper supply in 2019 was on commercial-sized rolls. This is created from different mills and stock than our toilet paper.
Lockdown pushed toilet paper demand to residential rolls, causing shortages (the TP hoarding story was just another pandemic urban legend). Because supermarket stores don't have accounts with commercial paper distributors, ordering from languishing stores was difficult. Kleenex and paper towel substitutions caused greater shortages.
All that drove increased costs in numerous product categories, and there were more cases. These increases are transient, caused by supply chain inefficiencies that are resolving.
Demand for frontline staff saw a one-time repricing of pay, which is being recouped as we speak.
Illnesses. Brittle, hollowed-out global supply chains aggravated this. The constant pursuit of cheap labor and minimal regulation by monopolies that dominate most sectors means things are manufactured in far-flung locations. Financialization means any surplus capital assets were sold off years ago, leaving firms with little production slack. After the epidemic, several of these systems took years to restart.
Automobiles are to blame. Financialization and monopolization consolidated microchip and auto production in Taiwan and China. When the lockdowns came, these worldwide corporations cancelled their chip orders, and when they placed fresh orders, they were at the back of the line.
That drove up car prices, which is why the US has slightly higher inflation than other wealthy countries: the economy is car-centric. Automobile prices account for 9% of the CPI. France: 3.6%
Rent shocks and telecommuting. After the epidemic, many professionals moved to exurbs, small towns, and the countryside to work from home. As commercial properties were vacated, it was impractical to adapt them for residential use due to planning restrictions. Addressing these restrictions will cut rent prices more than raising inflation rates, which halts housing construction.
Statistical mirages cause some rent inflation. The CPI estimates what homeowners would pay to rent their properties. When rents rise in your neighborhood, the CPI believes you're spending more on rent even if you have a 30-year fixed-rate mortgage.
Market dominance. Almost every area of the US economy is dominated by monopolies, whose CEOs disclose on investor calls that they use inflation scares to jack up prices and make record profits.
https://pluralistic.net/2022/02/02/its-the-economy-stupid/#overinflated
Long-term profit margins are rising. Markups averaged 26% from 1960-1980. 2021: 72%. Market concentration explains 81% of markup increases (e.g. monopolization). Profit margins reach a 70-year high in 2022. These elements interact. Monopolies thin out their sectors, making them brittle and sensitive to shocks.
If we're worried about a shrinking workforce, there are more humanitarian and sensible solutions than causing a recession and mass unemployment. Instead, we may boost US production capacity by easing workers' entry into the workforce.
https://pluralistic.net/2022/06/01/factories-to-condos-pipeline/#stuff-not-money
US female workforce participation ranks towards the bottom of developed countries. Many women can't afford to work due to America's lack of daycare, low earnings, and bad working conditions in female-dominated fields. If America doesn't have enough workers, childcare subsidies and minimum wages can help.
By contrast, driving the country into recession with interest-rate hikes will reduce employment, and the last recruited (women, minorities) are the first fired and the last to be rehired. Forcing America into recession won't enhance its capacity to create what its people want; it will degrade it permanently.
Nothing the Fed does can stop price hikes from international markets, lack of supply chain investment, COVID-19 disruptions, climate change, the Ukraine war, or market power. They can worsen it. When supply problems generate inflation, raising interest rates decreases investments that can remedy shortages.
Increasing interest rates won't cut rents since landlords pass on the expenses and high rates restrict investment in new dwellings where tenants could escape the costs.
Fixing the supply fixes supply-side inflation. Increase renewables investment (as the Inflation Reduction Act does). Monopolies can be busted (as the IRA does). Reshore key goods (as the CHIPS Act does). Better pay and child care attract employees.
Windfall taxes can claw back price-gouging corporations' monopoly earnings.
https://pluralistic.net/2022/03/15/sanctions-financing/#soak-the-rich
In 2008, we ruled out fiscal solutions (bailouts for debtors) and turned to monetary policy (bank bailouts). This preserved the economy but increased inequality and eroded public trust.
Monetary policy won't help. Even monetary policy enthusiasts recognize an 18-month lag between action and result. That suggests monetary tightening is unnecessary. Like the medieval bloodletter, central bankers whose interest rate hikes don't work swiftly may do more of the same, bringing the economy to its knees.
Interest rates must rise. Zero-percent interest fueled foolish speculation and financialization. Increasing rates will stop this. Increasing interest rates will destroy the economy and dampen inflation.
Then what? All recent evidence indicate to inflation decreasing on its own, as the authors argue. Supply side difficulties are finally being overcome, evidence shows. Energy and food prices are showing considerable mean reversion, which is disinflationary.
The authors don't recommend doing nothing. Best case scenario, they argue, is that the Fed won't keep raising interest rates until morale improves.

Sofien Kaabar, CFA
3 years ago
How to Make a Trading Heatmap
Python Heatmap Technical Indicator
Heatmaps provide an instant overview. They can be used with correlations or to predict reactions or confirm the trend in trading. This article covers RSI heatmap creation.
The Market System
Market regime:
Bullish trend: The market tends to make higher highs, which indicates that the overall trend is upward.
Sideways: The market tends to fluctuate while staying within predetermined zones.
Bearish trend: The market has the propensity to make lower lows, indicating that the overall trend is downward.
Most tools detect the trend, but we cannot predict the next state. The best way to solve this problem is to assume the current state will continue and trade any reactions, preferably in the trend.
If the EURUSD is above its moving average and making higher highs, a trend-following strategy would be to wait for dips before buying and assuming the bullish trend will continue.
Indicator of Relative Strength
J. Welles Wilder Jr. introduced the RSI, a popular and versatile technical indicator. Used as a contrarian indicator to exploit extreme reactions. Calculating the default RSI usually involves these steps:
Determine the difference between the closing prices from the prior ones.
Distinguish between the positive and negative net changes.
Create a smoothed moving average for both the absolute values of the positive net changes and the negative net changes.
Take the difference between the smoothed positive and negative changes. The Relative Strength RS will be the name we use to describe this calculation.
To obtain the RSI, use the normalization formula shown below for each time step.
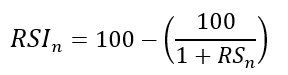
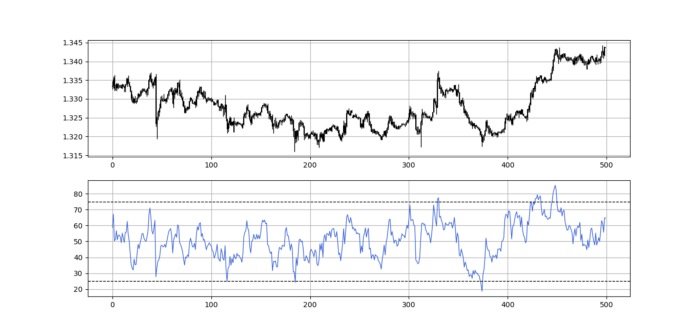
The 13-period RSI and black GBPUSD hourly values are shown above. RSI bounces near 25 and pauses around 75. Python requires a four-column OHLC array for RSI coding.
import numpy as np
def add_column(data, times):

    for i in range(1, times + 1):

        new = np.zeros((len(data), 1), dtype = float)

        data = np.append(data, new, axis = 1)
    return data
def delete_column(data, index, times):

    for i in range(1, times + 1):

        data = np.delete(data, index, axis = 1)
    return data
def delete_row(data, number):

    data = data[number:, ]

    return data
def ma(data, lookback, close, position):

    data = add_column(data, 1)

    for i in range(len(data)):

            try:

                data[i, position] = (data[i - lookback + 1:i + 1, close].mean())

            except IndexError:

                pass

    data = delete_row(data, lookback)

    return data
def smoothed_ma(data, alpha, lookback, close, position):

    lookback = (2 * lookback) - 1

    alpha = alpha / (lookback + 1.0)

    beta  = 1 - alpha

    data = ma(data, lookback, close, position)
    data[lookback + 1, position] = (data[lookback + 1, close] * alpha) + (data[lookback, position] * beta)
    for i in range(lookback + 2, len(data)):

            try:

                data[i, position] = (data[i, close] * alpha) + (data[i - 1, position] * beta)

            except IndexError:

                pass

    return data
def rsi(data, lookback, close, position):

    data = add_column(data, 5)

    for i in range(len(data)):

        data[i, position] = data[i, close] - data[i - 1, close]

    for i in range(len(data)):

        if data[i, position] > 0:

            data[i, position + 1] = data[i, position]

        elif data[i, position] < 0:

            data[i, position + 2] = abs(data[i, position])

    data = smoothed_ma(data, 2, lookback, position + 1, position + 3)
    data = smoothed_ma(data, 2, lookback, position + 2, position + 4)
    data[:, position + 5] = data[:, position + 3] / data[:, position + 4]

    data[:, position + 6] = (100 - (100 / (1 + data[:, position + 5])))
    data = delete_column(data, position, 6)
    data = delete_row(data, lookback)
    return data
Make sure to focus on the concepts and not the code. You can find the codes of most of my strategies in my books. The most important thing is to comprehend the techniques and strategies.
My weekly market sentiment report uses complex and simple models to understand the current positioning and predict the future direction of several major markets. Check out the report here:
Using the Heatmap to Find the Trend
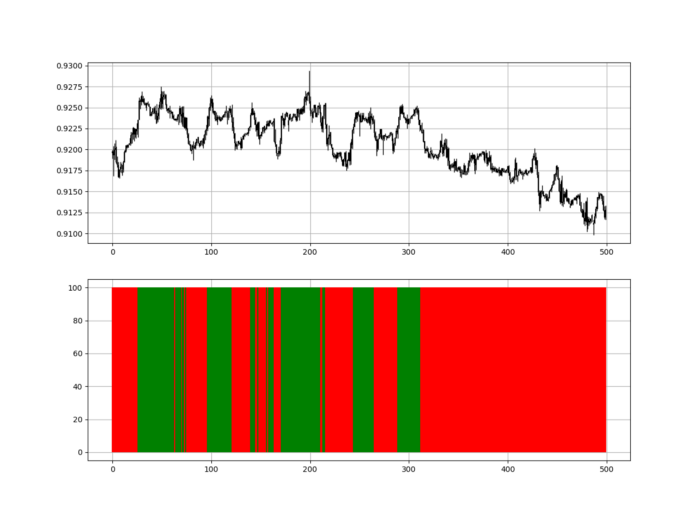
RSI trend detection is easy but useless. Bullish and bearish regimes are in effect when the RSI is above or below 50, respectively. Tracing a vertical colored line creates the conditions below. How:
When the RSI is higher than 50, a green vertical line is drawn.
When the RSI is lower than 50, a red vertical line is drawn.
Zooming out yields a basic heatmap, as shown below.
Plot code:
def indicator_plot(data, second_panel, window = 250):
    fig, ax = plt.subplots(2, figsize = (10, 5))
    sample = data[-window:, ]
    for i in range(len(sample)):
        ax[0].vlines(x = i, ymin = sample[i, 2], ymax = sample[i, 1], color = 'black', linewidth = 1)
        if sample[i, 3] > sample[i, 0]:
            ax[0].vlines(x = i, ymin = sample[i, 0], ymax = sample[i, 3], color = 'black', linewidth = 1.5)
        if sample[i, 3] < sample[i, 0]:
            ax[0].vlines(x = i, ymin = sample[i, 3], ymax = sample[i, 0], color = 'black', linewidth = 1.5)
        if sample[i, 3] == sample[i, 0]:
            ax[0].vlines(x = i, ymin = sample[i, 3], ymax = sample[i, 0], color = 'black', linewidth = 1.5)
    ax[0].grid()
    for i in range(len(sample)):
        if sample[i, second_panel] > 50:
            ax[1].vlines(x = i, ymin = 0, ymax = 100, color = 'green', linewidth = 1.5)
        if sample[i, second_panel] < 50:
            ax[1].vlines(x = i, ymin = 0, ymax = 100, color = 'red', linewidth = 1.5)
    ax[1].grid()
indicator_plot(my_data, 4, window = 500)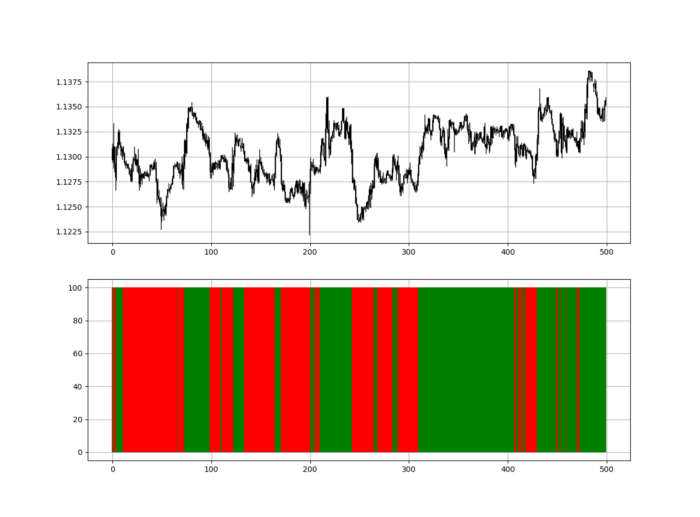
Call RSI on your OHLC array's fifth column. 4. Adjusting lookback parameters reduces lag and false signals. Other indicators and conditions are possible.
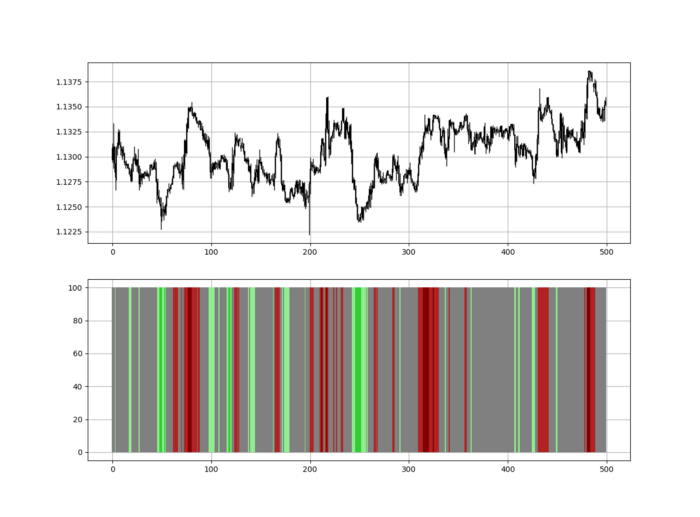
Another suggestion is to develop an RSI Heatmap for Extreme Conditions.
Contrarian indicator RSI. The following rules apply:
Whenever the RSI is approaching the upper values, the color approaches red.
The color tends toward green whenever the RSI is getting close to the lower values.
Zooming out yields a basic heatmap, as shown below.
Plot code:
import matplotlib.pyplot as plt
def indicator_plot(data, second_panel, window = 250):
    fig, ax = plt.subplots(2, figsize = (10, 5))
    sample = data[-window:, ]
    for i in range(len(sample)):
        ax[0].vlines(x = i, ymin = sample[i, 2], ymax = sample[i, 1], color = 'black', linewidth = 1)
        if sample[i, 3] > sample[i, 0]:
            ax[0].vlines(x = i, ymin = sample[i, 0], ymax = sample[i, 3], color = 'black', linewidth = 1.5)
        if sample[i, 3] < sample[i, 0]:
            ax[0].vlines(x = i, ymin = sample[i, 3], ymax = sample[i, 0], color = 'black', linewidth = 1.5)
        if sample[i, 3] == sample[i, 0]:
            ax[0].vlines(x = i, ymin = sample[i, 3], ymax = sample[i, 0], color = 'black', linewidth = 1.5)
    ax[0].grid()
    for i in range(len(sample)):
        if sample[i, second_panel] > 90:
            ax[1].vlines(x = i, ymin = 0, ymax = 100, color = 'red', linewidth = 1.5)
        if sample[i, second_panel] > 80 and sample[i, second_panel] < 90:
            ax[1].vlines(x = i, ymin = 0, ymax = 100, color = 'darkred', linewidth = 1.5)
        if sample[i, second_panel] > 70 and sample[i, second_panel] < 80:
            ax[1].vlines(x = i, ymin = 0, ymax = 100, color = 'maroon', linewidth = 1.5)
        if sample[i, second_panel] > 60 and sample[i, second_panel] < 70:
            ax[1].vlines(x = i, ymin = 0, ymax = 100, color = 'firebrick', linewidth = 1.5)
        if sample[i, second_panel] > 50 and sample[i, second_panel] < 60:
            ax[1].vlines(x = i, ymin = 0, ymax = 100, color = 'grey', linewidth = 1.5)
        if sample[i, second_panel] > 40 and sample[i, second_panel] < 50:
            ax[1].vlines(x = i, ymin = 0, ymax = 100, color = 'grey', linewidth = 1.5)
        if sample[i, second_panel] > 30 and sample[i, second_panel] < 40:
            ax[1].vlines(x = i, ymin = 0, ymax = 100, color = 'lightgreen', linewidth = 1.5)
        if sample[i, second_panel] > 20 and sample[i, second_panel] < 30:
            ax[1].vlines(x = i, ymin = 0, ymax = 100, color = 'limegreen', linewidth = 1.5)
        if sample[i, second_panel] > 10 and sample[i, second_panel] < 20:
            ax[1].vlines(x = i, ymin = 0, ymax = 100, color = 'seagreen', linewidth = 1.5)
        if sample[i, second_panel] > 0 and sample[i, second_panel] < 10:
            ax[1].vlines(x = i, ymin = 0, ymax = 100, color = 'green', linewidth = 1.5)
    ax[1].grid()
indicator_plot(my_data, 4, window = 500)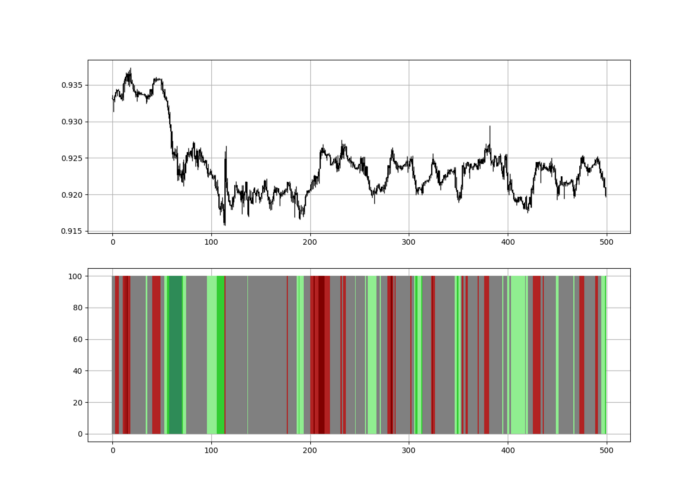
Dark green and red areas indicate imminent bullish and bearish reactions, respectively. RSI around 50 is grey.
Summary
To conclude, my goal is to contribute to objective technical analysis, which promotes more transparent methods and strategies that must be back-tested before implementation.
Technical analysis will lose its reputation as subjective and unscientific.
When you find a trading strategy or technique, follow these steps:
Put emotions aside and adopt a critical mindset.
Test it in the past under conditions and simulations taken from real life.
Try optimizing it and performing a forward test if you find any potential.
Transaction costs and any slippage simulation should always be included in your tests.
Risk management and position sizing should always be considered in your tests.
After checking the above, monitor the strategy because market dynamics may change and make it unprofitable.

Desiree Peralta
3 years ago
How to Use the 2023 Recession to Grow Your Wealth Exponentially
This season's three best money moves.
“Millionaires are made in recessions.” — Time Capital
We're in a serious downturn, whether or not we're in a recession.
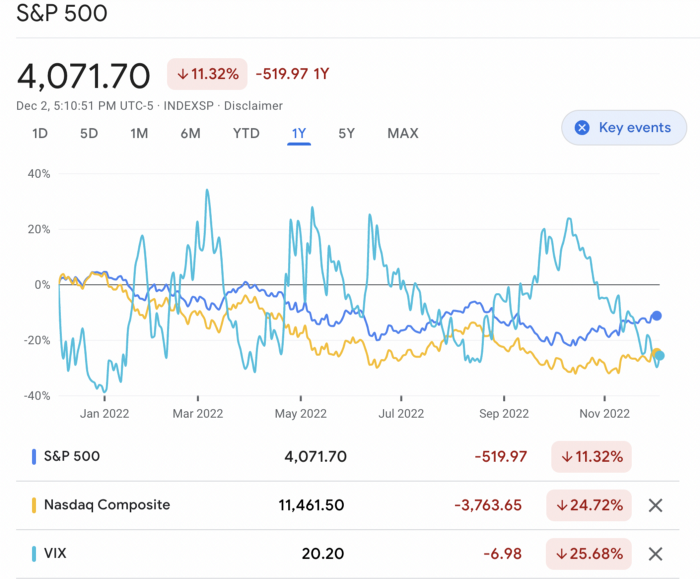
97% of business owners are decreasing costs by more than 10%, and all markets are down 30%.
If you know what you're doing and analyze the markets correctly, this is your chance to become a millionaire.
In any recession, there are always excellent possibilities to seize. Real estate, crypto, stocks, enterprises, etc.
What you do with your money could influence your future riches.
This article analyzes the three key markets, their circumstances for 2023, and how to profit from them.
Ways to make money on the stock market.
If you're conservative like me, you should invest in an index fund. Most of these funds are down 10-30% of ATH:
In earlier recessions, most money index funds lost 20%. After this downturn, they grew and passed the ATH in subsequent months.
Now is the greatest moment to invest in index funds to grow your money in a low-risk approach and make 20%.
If you want to be risky but wise, pick companies that will get better next year but are struggling now.
Even while we can't be 100% confident of a company's future performance, we know some are strong and will have a fantastic year.
Microsoft (down 22%), JPMorgan Chase (15.6%), Amazon (45%), and Disney (33.8%).
These firms give dividends, so you can earn passively while you wait.
So I consider that a good strategy to make wealth in the current stock market is to create two portfolios: one based on index funds to earn 10% to 20% profit when the corrections end, and the other based on individual stocks of popular and strong companies to earn 20%-30% return and dividends while you wait.
How to profit from the downturn in the real estate industry.
With rising mortgage rates, it's the worst moment to buy a home if you don't want to be eaten by banks. In the U.S., interest rates are double what they were three years ago, so buying now looks foolish.
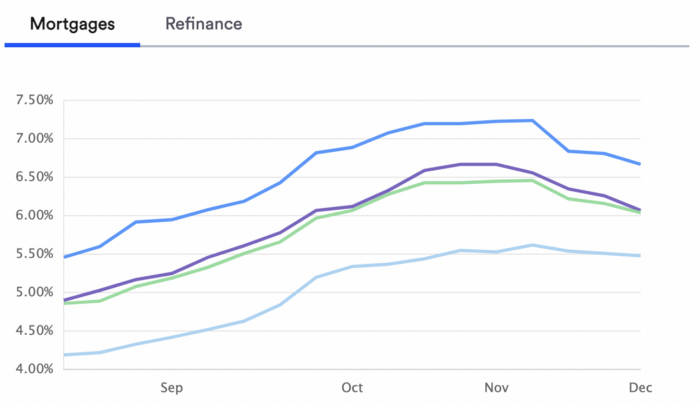
Due to these rates, property prices are falling, but that won't last long since individuals will take advantage.
According to historical data, now is the ideal moment to buy a house for the next five years and perhaps forever.
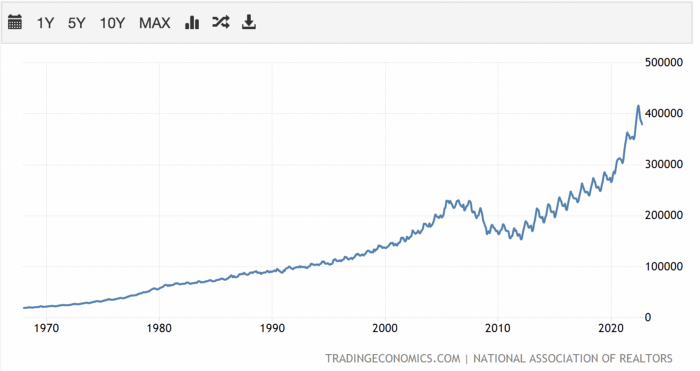
If you can buy a house, do it. You can refinance the interest at a lower rate with acceptable credit, but not the house price.
Take advantage of the housing market prices now because you won't find a decent deal when rates normalize.
How to profit from the cryptocurrency market.
This is the riskiest market to tackle right now, but it could offer the most opportunities if done appropriately.
The most powerful cryptocurrencies are down more than 60% from last year: $68,990 for BTC and $4,865 for ETH.
If you focus on those two coins, you can make 30%-60% without waiting for them to return to their ATH, and they're low enough to be a solid investment.
I don't encourage trying other altcoins because the crypto market is in crisis and you can lose everything if you're greedy.
Still, the main Cryptos are a good investment provided you store them in an external wallet and follow financial gurus' security advice.
Last thoughts
We can't anticipate a recession until it ends. We can't forecast a market or asset's lowest point, therefore waiting makes little sense.
If you want to develop your wealth, assess the money prospects on all the marketplaces and initiate long-term trades.
Many millionaires are made during recessions because they don't fear negative figures and use them to scale their money.
You might also like

Ethan Siegel
3 years ago
How you view the year will change after using this one-page calendar.
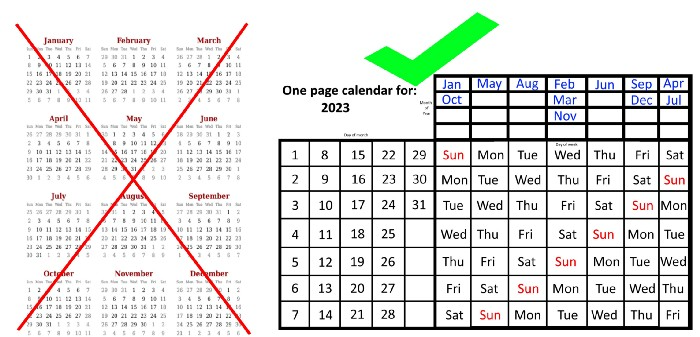
No other calendar is simpler, smaller, and reusable year after year. It works and is used here.
Most of us discard and replace our calendars annually. Each month, we move our calendar ahead another page, thus if we need to know which day of the week corresponds to a given day/month combination, we have to calculate it or flip forward/backward to the corresponding month. Questions like:
What day does this year's American Thanksgiving fall on?
Which months contain a Friday the thirteenth?
When is July 4th? What day of the week?
Alternatively, what day of the week is Christmas?
They're hard to figure out until you switch to the right month or look up all the months.
However, mathematically, the answers to these questions or any question that requires matching the day of the week with the day/month combination in a year are predictable, basic, and easy to work out. If you use this one-page calendar instead of a 12-month calendar, it lasts the whole year and is easy to alter for future years. Let me explain.
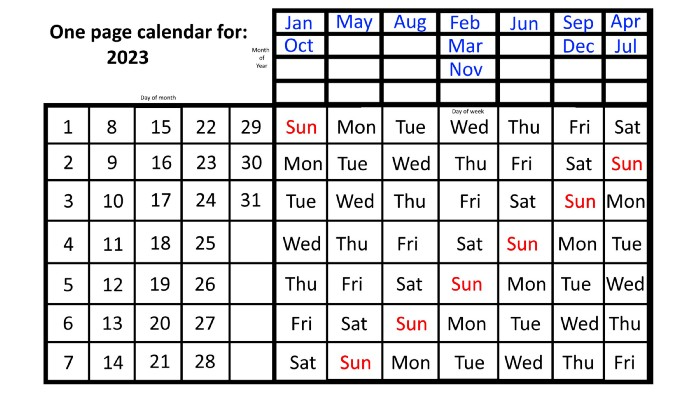
The 2023 one-page calendar is above. The days of the month are on the lower left, which works for all months if you know that:
There are 31 days in January, March, May, July, August, October, and December.
All of the months of April, June, September, and November have 30 days.
And depending on the year, February has either 28 days (in non-leap years) or 29 days (in leap years).
If you know this, this calendar makes it easy to match the day/month of the year to the weekday.
Here are some instances. American Thanksgiving is always on the fourth Thursday of November. You'll always know the month and day of the week, but the date—the day in November—changes each year.
On any other calendar, you'd have to flip to November to see when the fourth Thursday is. This one-page calendar only requires:
pick the month of November in the top-right corner to begin.
drag your finger down until Thursday appears,
then turn left and follow the monthly calendar until you reach the fourth Thursday.
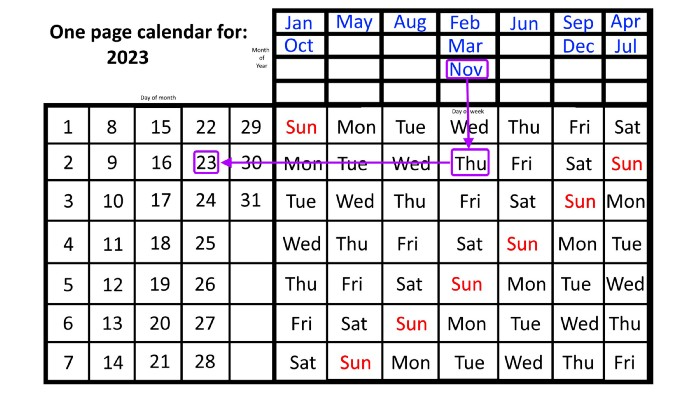
It's obvious: 2023 is the 23rd American Thanksgiving. For every month and day-of-the-week combination, start at the month, drag your finger down to the desired day, and then move to the left to see which dates match.
What if you knew the day of the week and the date of the month, but not the month(s)?
A different method using the same one-page calendar gives the answer. Which months have Friday the 13th this year? Just:
begin on the 13th of the month, the day you know you desire,
then swipe right with your finger till Friday appears.
and then work your way up until you can determine which months the specific Friday the 13th falls under.
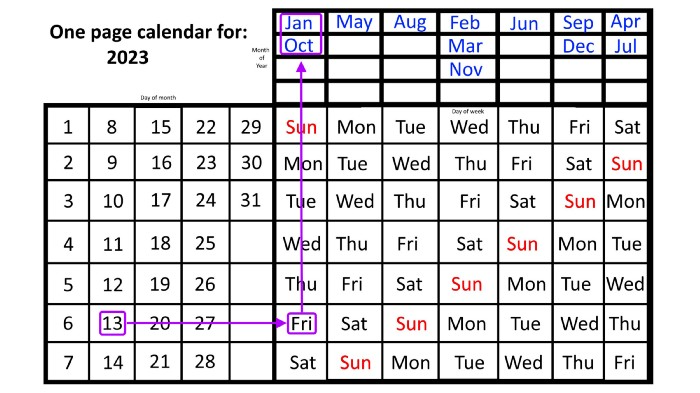
One Friday the 13th occurred in January 2023, and another will occur in October.
The most typical reason to consult a calendar is when you know the month/day combination but not the day of the week.
Compared to single-month calendars, the one-page calendar excels here. Take July 4th, for instance. Find the weekday here:
beginning on the left on the fourth of the month, as you are aware,
also begin with July, the month of the year you are most familiar with, at the upper right,
you should move your two fingers in the opposite directions till they meet: on a Tuesday in 2023.
That's how you find your selected day/month combination's weekday.
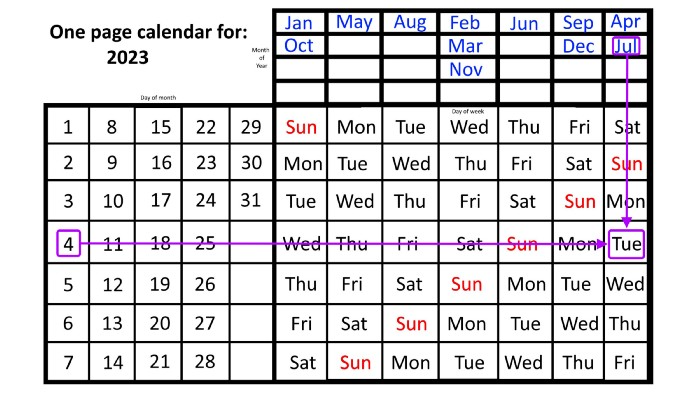
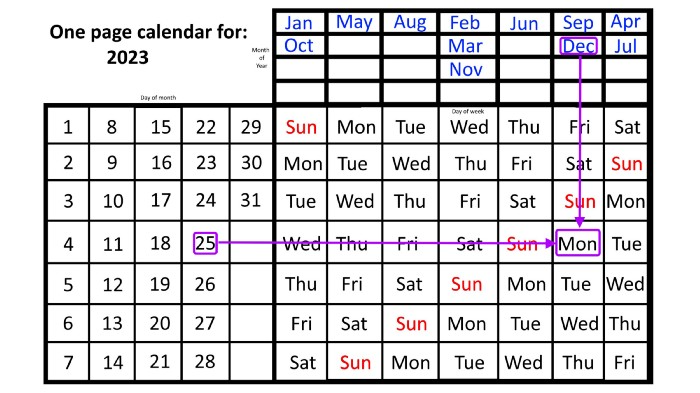
Another example: Christmas. Christmas Day is always December 25th, however unless your conventional calendar is open to December of your particular year, a question like "what day of the week is Christmas?" difficult to answer.
Unlike the one-page calendar!
Remember the left-hand day of the month. Top-right, you see the month. Put two fingers, one from each hand, on the date (25th) and the month (December). Slide the day hand to the right and the month hand downwards until they touch.
They meet on Monday—December 25, 2023.
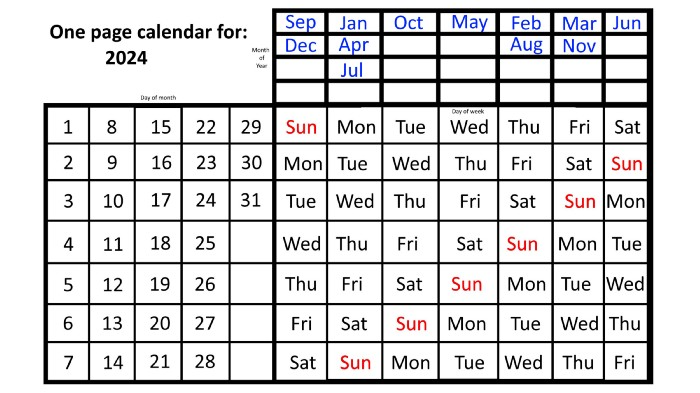
For 2023, that's fine, but what happens in 2024? Even worse, what if we want to know the day-of-the-week/day/month combo many years from now?
I think the one-page calendar shines here.
Except for the blue months in the upper-right corner of the one-page calendar, everything is the same year after year. The months also change in a consistent fashion.
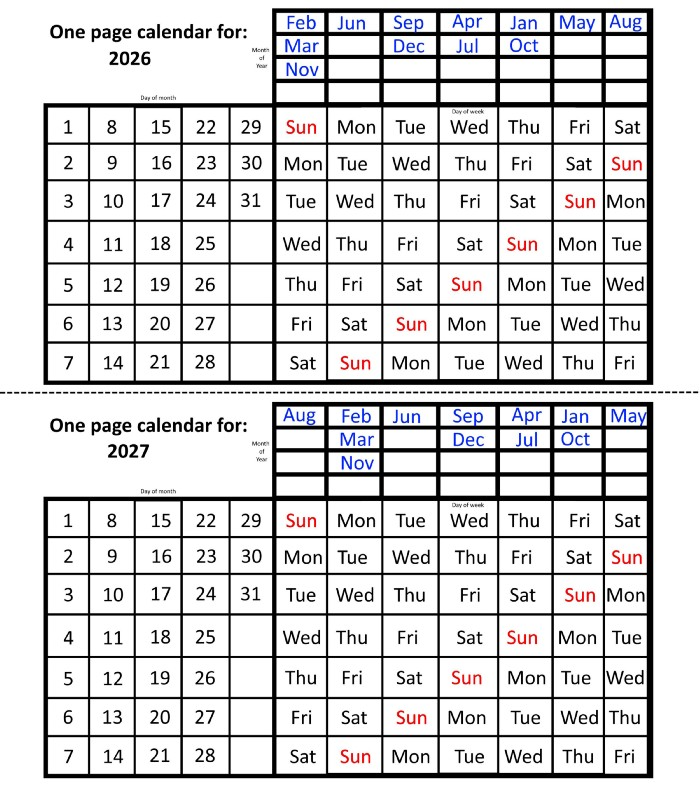
Each non-leap year has 365 days—one more than a full 52 weeks (which is 364). Since January 1, 2023 began on a Sunday and 2023 has 365 days, we immediately know that December 31, 2023 will conclude on a Sunday (which you can confirm using the one-page calendar) and that January 1, 2024 will begin on a Monday. Then, reorder the months for 2024, taking in mind that February will have 29 days in a leap year.
Please note the differences between 2023 and 2024 month placement. In 2023:
October and January began on the same day of the week.
On the following Monday of the week, May began.
August started on the next day,
then the next weekday marked the start of February, March, and November, respectively.
Unlike June, which starts the following weekday,
While September and December start on the following day of the week,
Lastly, April and July start one extra day later.
Since 2024 is a leap year, February has 29 days, disrupting the rhythm. Month placements change to:
The first day of the week in January, April, and July is the same.
October will begin the following day.
Possibly starting the next weekday,
February and August start on the next weekday,
beginning on the following day of the week between March and November,
beginning the following weekday in June,
and commencing one more day of the week after that, September and December.
Due to the 366-day leap year, 2025 will start two days later than 2024 on January 1st.
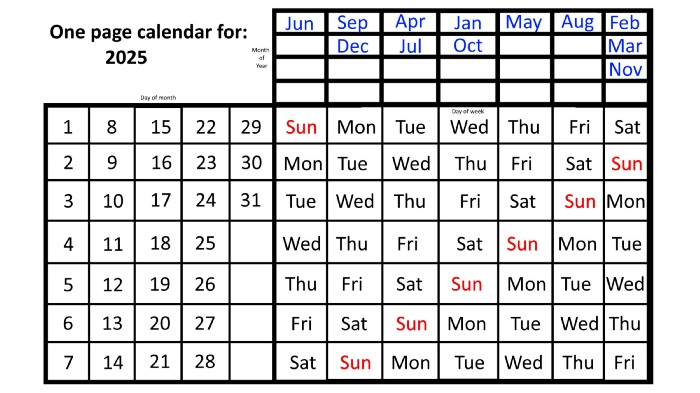
Now, looking at the 2025 calendar, you can see that the 2023 pattern of which months start on which days is repeated! The sole variation is a shift of three days-of-the-week ahead because 2023 had one more day (365) than 52 full weeks (364), and 2024 had two more days (366). Again,
On Wednesday this time, January and October begin on the same day of the week.
Although May begins on Thursday,
August begins this Friday.
March, November, and February all begin on a Saturday.
Beginning on a Sunday in June
Beginning on Monday are September and December,
and on Tuesday, April and July begin.
In 2026 and 2027, the year will commence on a Thursday and a Friday, respectively.
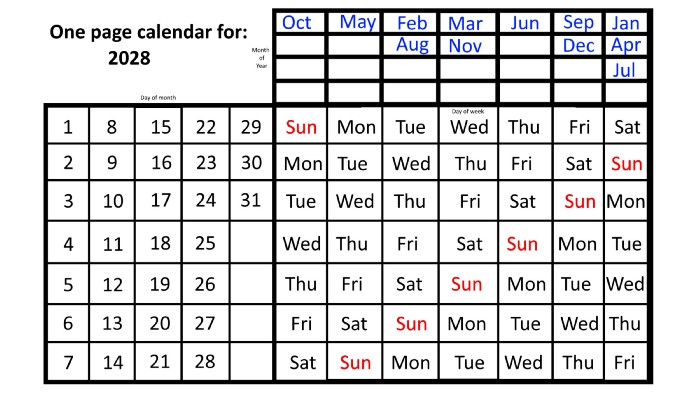
We must return to our leap year monthly arrangement in 2028. Yes, January 1, 2028 begins on a Saturday, but February, which begins on a Tuesday three days before January, will have 29 days. Thus:
Start dates for January, April, and July are all Saturdays.
Given that October began on Sunday,
Although May starts on a Monday,
beginning on a Tuesday in February and August,
Beginning on a Wednesday in March and November,
Beginning on Thursday, June
and Friday marks the start of September and December.
This is great because there are only 14 calendar configurations: one for each of the seven non-leap years where January 1st begins on each of the seven days of the week, and one for each of the seven leap years where it begins on each day of the week.
The 2023 calendar will function in 2034, 2045, 2051, 2062, 2073, 2079, 2090, 2102, 2113, and 2119. Except when passing over a non-leap year that ends in 00, like 2100, the repeat time always extends to 12 years or shortens to an extra 6 years.
The pattern is repeated in 2025's calendar in 2031, 2042, 2053, 2059, 2070, 2081, 2087, 2098, 2110, and 2121.
The extra 6-year repeat at the end of the century on the calendar for 2026 will occur in the years 2037, 2043, 2054, 2065, 2071, 2082, 2093, 2099, 2105, and 2122.
The 2027s calendar repeats in 2038, 2049, 2055, 2066, 2077, 2083, 2094, 2100, 2106, and 2117, almost exactly matching the 2026s pattern.
For leap years, the recurrence pattern is every 28 years when not passing a non-leap year ending in 00, or 12 or 40 years when we do. 2024's calendar repeats in 2052, 2080, 2120, 2148, 2176, and 2216; 2028's in 2056, 2084, 2124, 2152, 2180, and 2220.
Knowing January 1st and whether it's a leap year lets you construct a one-page calendar for any year. Try it—you might find it easier than any other alternative!
Jason Kottke
3 years ago
Lessons on Leadership from the Dancing Guy
This is arguably the best three-minute demonstration I've ever seen of anything. Derek Sivers turns a shaky video of a lone dancing guy at a music festival into a leadership lesson.
A leader must have the courage to stand alone and appear silly. But what he's doing is so straightforward that it's almost instructive. This is critical. You must be simple to follow!
Now comes the first follower, who plays an important role: he publicly demonstrates how to follow. The leader embraces him as an equal, so it's no longer about the leader — it's about them, plural. He's inviting his friends to join him. It takes courage to be the first follower! You stand out and dare to be mocked. Being a first follower is a style of leadership that is underappreciated. The first follower elevates a lone nut to the position of leader. If the first follower is the spark that starts the fire, the leader is the flint.
This link was sent to me by @ottmark, who noted its resemblance to Kurt Vonnegut's three categories of specialists required for revolution.
The rarest of these specialists, he claims, is an actual genius – a person capable generating seemingly wonderful ideas that are not widely known. "A genius working alone is generally dismissed as a crazy," he claims.
The second type of specialist is much easier to find: a highly intellectual person in good standing in his or her community who understands and admires the genius's new ideas and can attest that the genius is not insane. "A person like him working alone can only crave loudly for changes, but fail to say what their shapes should be," Slazinger argues.
Jeff Veen reduced the three personalities to "the inventor, the investor, and the evangelist" on Twitter.

Logan Rane
3 years ago
I questioned Chat-GPT for advice on the top nonfiction books. Here's What It Suggests
You have to use it.

Chat-GPT is a revolution.
All social media outlets are discussing it. How it will impact the future and different things.
True.
I've been using Chat-GPT for a few days, and it's a rare revolution. It's amazing and will only improve.
I asked Chat-GPT about the best non-fiction books. It advised this, albeit results rely on interests.
The Immortal Life of Henrietta Lacks
by Rebecca Skloot
Science, Biography
A impoverished tobacco farmer dies of cervical cancer in The Immortal Life of Henrietta Lacks. Her cell strand helped scientists treat polio and other ailments.
Rebecca Skloot discovers about Henrietta, her family, how the medical business exploited black Americans, and how her cells can live forever in a fascinating and surprising research.
You ought to read it.
if you want to discover more about the past of medicine.
if you want to discover more about American history.
Bad Blood: Secrets and Lies in a Silicon Valley Startup
by John Carreyrou
Tech, Bio
Bad Blood tells the terrifying story of how a Silicon Valley tech startup's blood-testing device placed millions of lives at risk.
John Carreyrou, a Pulitzer Prize-winning journalist, wrote this book.
Theranos and its wunderkind CEO, Elizabeth Holmes, climbed to popularity swiftly and then plummeted.
You ought to read it.
if you are a start-up employee.
specialists in medicine.
The Power of Now: A Guide to Spiritual Enlightenment
by Eckhart Tolle
Self-improvement, Spirituality
The Power of Now shows how to stop suffering and attain inner peace by focusing on the now and ignoring your mind.
The book also helps you get rid of your ego, which tries to control your ideas and actions.
If you do this, you may embrace the present, reduce discomfort, strengthen relationships, and live a better life.
You ought to read it.
if you're looking for serenity and illumination.
If you believe that you are ruining your life, stop.
if you're not happy.
The 7 Habits of Highly Effective People
by Stephen R. Covey
Profession, Success
The 7 Habits of Highly Effective People is an iconic self-help book.
This vital book offers practical guidance for personal and professional success.
This non-fiction book is one of the most popular ever.
You ought to read it.
if you want to reach your full potential.
if you want to discover how to achieve all your objectives.
if you are just beginning your journey toward personal improvement.
Sapiens: A Brief History of Humankind
by Yuval Noah Harari
Science, History
Sapiens explains how our species has evolved from our earliest ancestors to the technology age.
How did we, a species of hairless apes without tails, come to control the whole planet?
It describes the shifts that propelled Homo sapiens to the top.
You ought to read it.
if you're interested in discovering our species' past.
if you want to discover more about the origins of human society and culture.